|
Ocean Surface Currents Data |
The three primary ocean dats sets, used on our web-site, are Sea Surface Temperature (SST), Sea Surface Velocity (SSV) from ship-drift measurements, and (near-)surface drifting buoy trajectories.
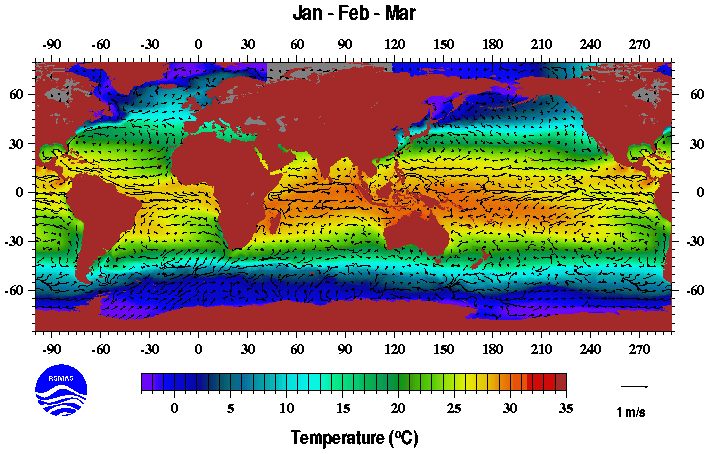
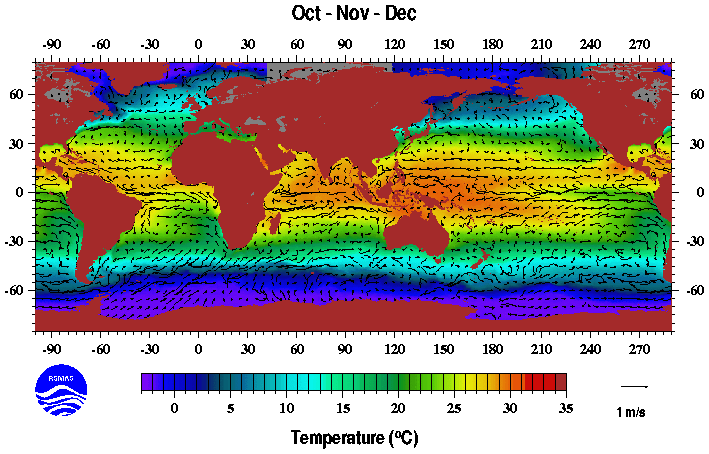
SST, derived from satellite-based Advanced Very-High Resolution Radiometer (AVHRR) measurements by the RSMAS Remote Sensing Group (Kearns et al, 2000; Kilpatrick et al, 2001), was space-time interpolated using the objective analysis of Mariano and Brown (1992). The interpolated day-time SST data are at 18 km spatial and 2 day temporal resolution for the time period of 1985 to 1999. There may be average biases on the order of 1/2 degree C in some areas and during some seasons as well as the same order random error component. This data set is available via anonymous ftp from jerry.rsmas.miami.edu.
The surface currents are from the US Coast Guard's Mariano Global Surface Velocity Analysis (MGSVA) 1.0 (Mariano et al. 1995). The temporal resolution of the surface current data is monthly and the horizontal resolution is 1 degree longitude and latitude. The surface currents are derived from ship-drift estimates made by merchant and military ships. The data have a random error of about 10 cm/s and a bias error that increases with wind-speed. Plots of the monthly and seasonal fields are shown below. This data set is available via anonymous ftp from jerry.rsmas.miami.edu.
The drifting buoys have holey-sock drogues, centered at depths of 15 m, and are satellite tracked. Ocean currents are estimated by taking the temporal difference of nearby drifter positions. Velocity error is about 2 cm/s (Hansen and Poulain, 1996). There are over 600 low-cost Global Lagrangian Drifters presently being tracked all over the world. Historical Buoy Data are available. Click here to see a schematic of drifter design.
The maps presented here are plotted with Generic Mapping Tools (GMT).Thanks to Alan J. Wallcraft for the 'curvy arrow' program.
ReferencesHansen, D.V. and P.M Poulain, 1996: Quality Control and Interpolation of WOCE/TOGA drifter data. J. Atm. Oc. Tech., 13, 900-909.
Kearns, E.J., J.A. Hanafin, R. Evans, P.J. Minnett, and O.B. Brown, 2000: An independent assessment of Pathfinder AVHRR sea surface temperature accuracy using the Marine--Atmosphere Emitted Radiance Interferometer. Bulletin of the American Meteorological Society Vol. 81, No. 7, p. 1525-1536.
Kilpatrick, K., G.P. Podesta, and R. H. Evans. 2001: Overview of the NOAA/NASA advanced very high resolution radiometer Pathfinder algorithm for sea surface temperature and associated matchup database. Journal of Geophysical Research, 106, 9179M-P9197.
Mariano, A.J. and O.B. Brown, 1992: Efficient objective analysis of dynamically heterogeneous and nonstationary fields via the parameter matrix. Deep-Sea Res., 39(7/8), 1255-1271.
Mariano, A.J., E.H. Ryan, B.D. Perkins and S.Smithers, 1995: The Mariano Global Surface Velocity Analysis 1.0. USCG Report CG-D-34-95, 55 pp.
Ryan, E.H., A.J. Mariano, D.B. Olson, R.H. Evans, 1996: Global Sea Surface Temperature and Currents. 1996 Fall AGU Meeting Eos, Transactions, AGU, Vol 77, No 46, November 12, 1996 (OP22A-16).
Geoff Samuels has made a clickable map of the Caribbean and Mediterranean Seas that show the monthly means of these data sets as well as wind, air temperature, precipitation and water clarity.
| January | February | March | | | Winter |
| April | May | June | | | Spring |
| July | August | September | | | Summer |
| October | November | December | | | Fall |