 |
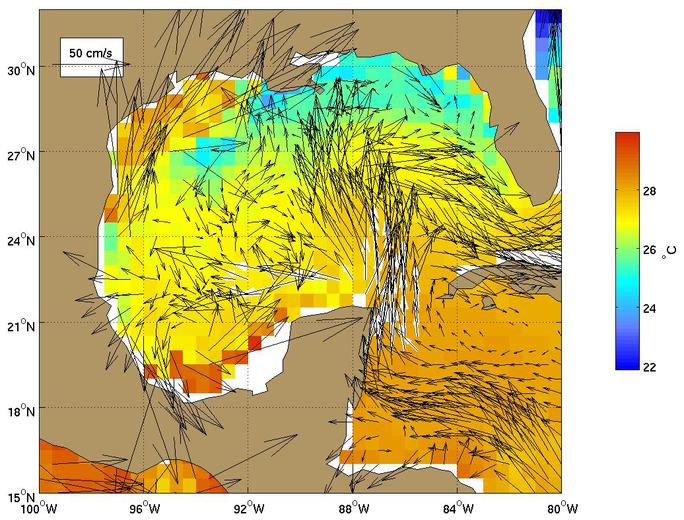
Figure 1.
The Yucatan current as represented by the Mariano Global Surface
Velocity Analysis (MGSVA).
Click here for example plots of
seasonal averages.
|
|
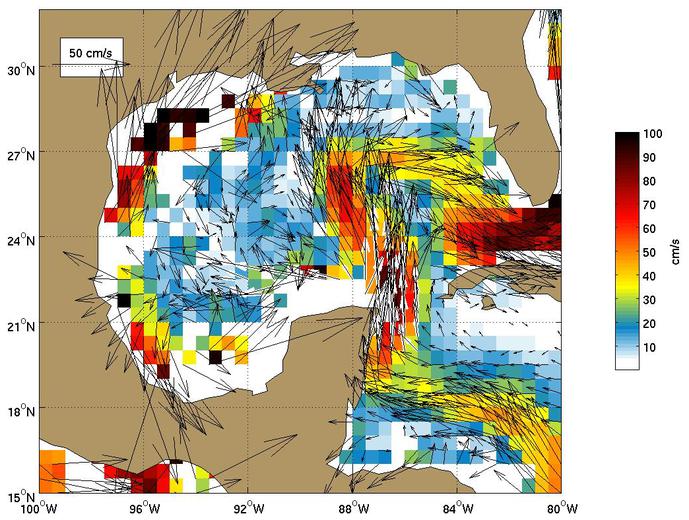
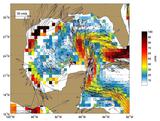
Figure 2.
Global Ocean Surface Velocities from Drifters
(top panel w/ SST, bottom panel w/ Speed)
Figure Caption is Under Construction.
Click here for example plots of
seasonal averages.
|
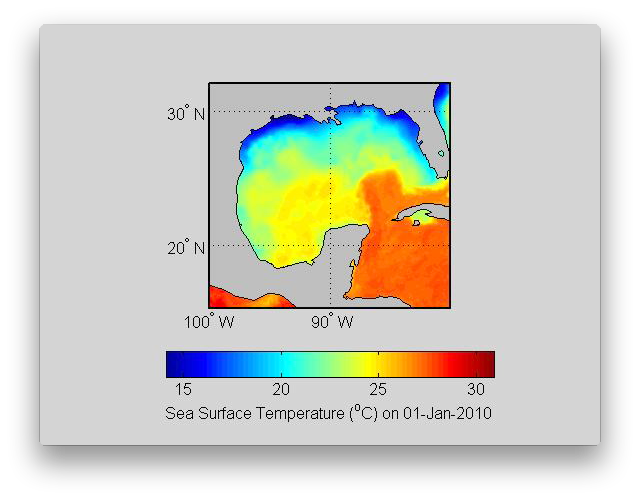 |
Figure 3.
( Click the thumbnail to play the animation. )
|
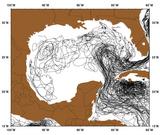 |
Figure 4.
|
 |
Figure 5.
|
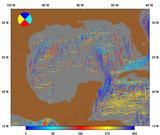 |
Figure 6.
|
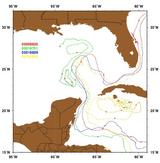 |
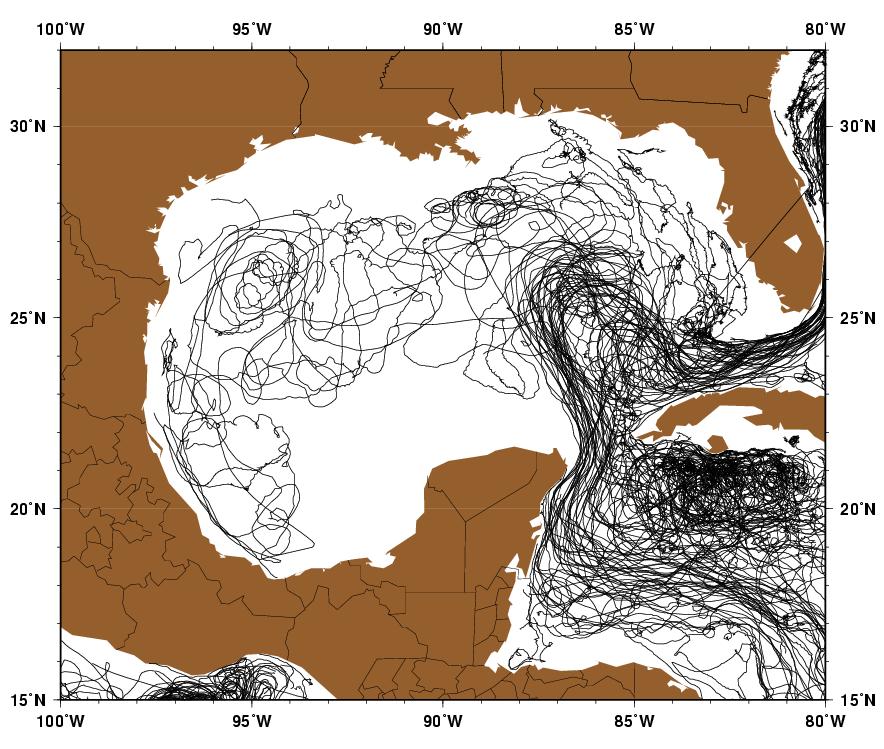
Figure 7.
These trajectories all show the well-known flow from the Caribbean Current
into the Loop Current via the Yucatan Current. Buoy 09730659 shows an indirect
path that includes substantial eddy motion in Cuban coastal waters.
Buoys 00018809 and 0018751 show a pathway that hugs the Yucatan Peninsula.
|
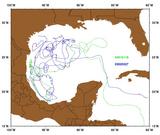 |
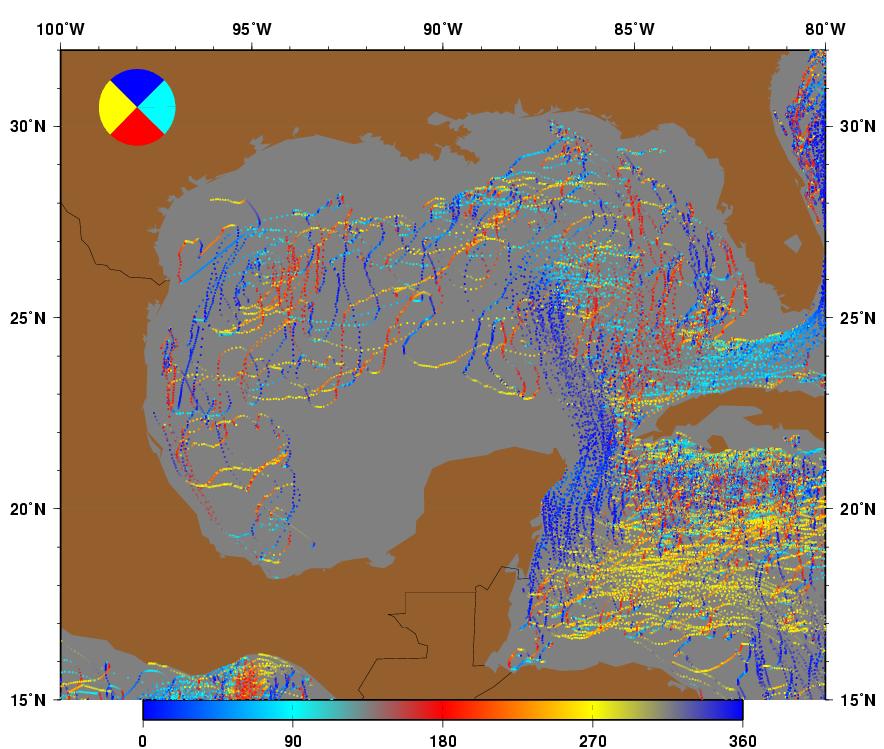
Figure 8.
These buoys are in the Yucatan Current and end up in the western part of
the Gulf of Mexico. This behavior should be contrasted with the floats in
figure 2 that feed the Loop Current and the FL current. These trajectories
reveal energetic eddy motion in the western Gulf of Mexico. Loop Current
Warm Core rings and their associated submesoscale features propagate
into this area from their formation area in the eastern Gulf.
|
 |
Figure 9.
AVRRR image of the sea-surface temperature (SST).
|
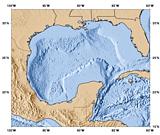 |
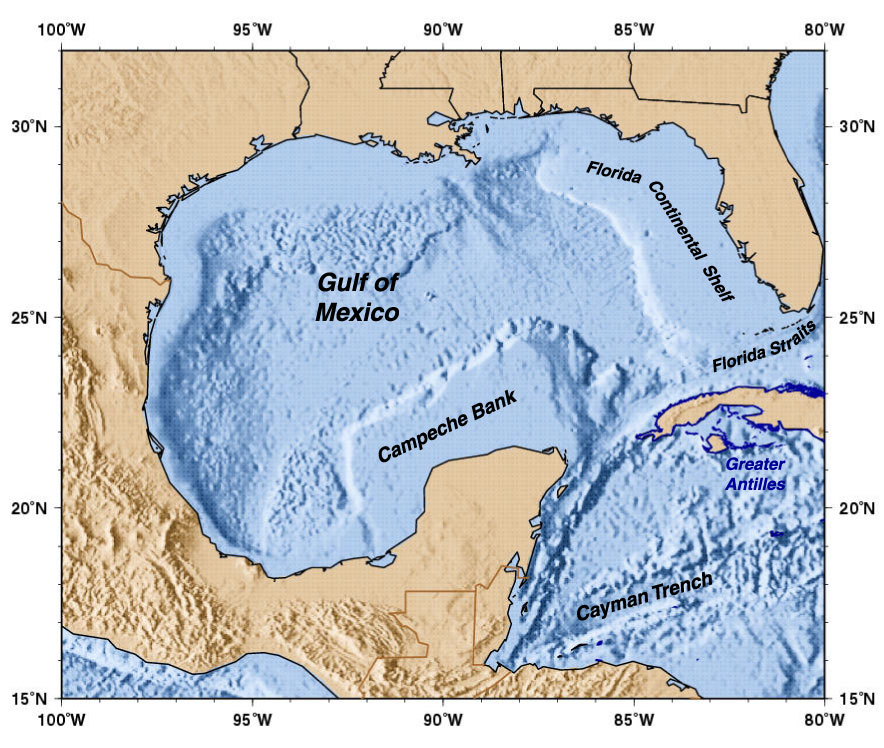
Figure 10.
Geography of the region.
|
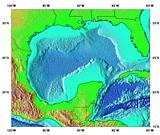 |
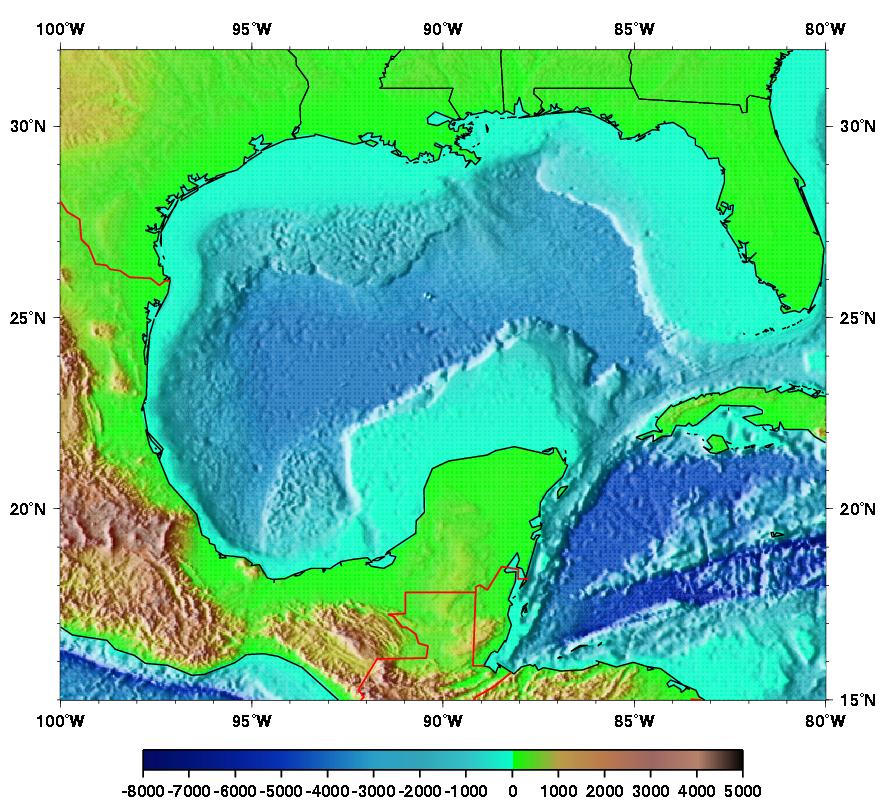
Figure 11.
Topography/Bathymetry of the region.
|