 |
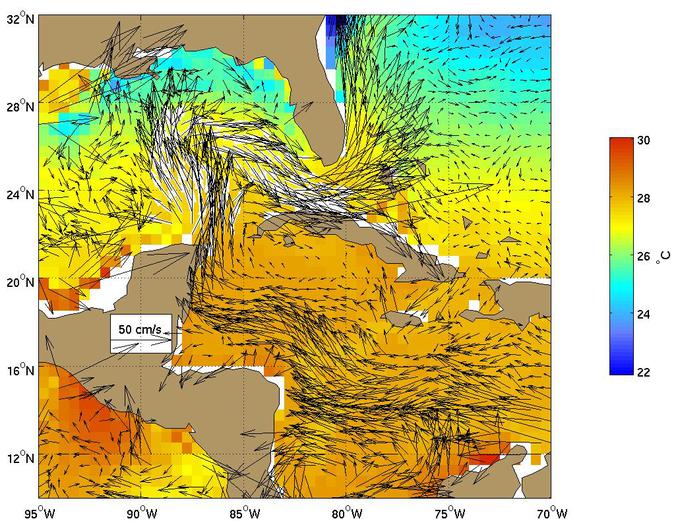
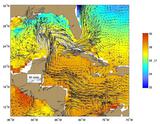
Figure 1.
The average ship-drift dervied surface velocities show the well-know
omega-shaped flow pattern of the Loop current. The Loop Current
(1) feeds the Florida Current that transports significant amounts of
heat poleward;
(2) transports surface waters of tropical origin into the Gulf of Mexico; and
(3) is fed by the Caribbean current and the Yucatan Current.
Click here for example plots of
seasonal averages.
|
|
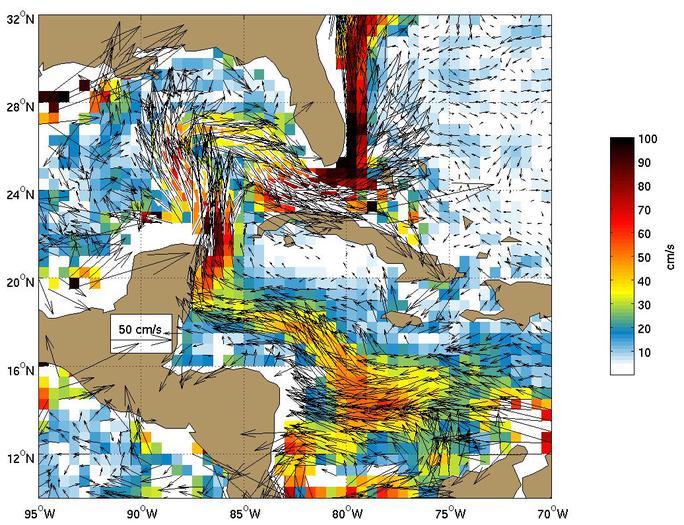
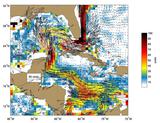
Figure 2.
Global Ocean Surface Velocities from Drifters
(top panel w/ SST, bottom panel w/ Speed)
Figure Caption is Under Construction.
Click here for example plots of
seasonal averages.
|
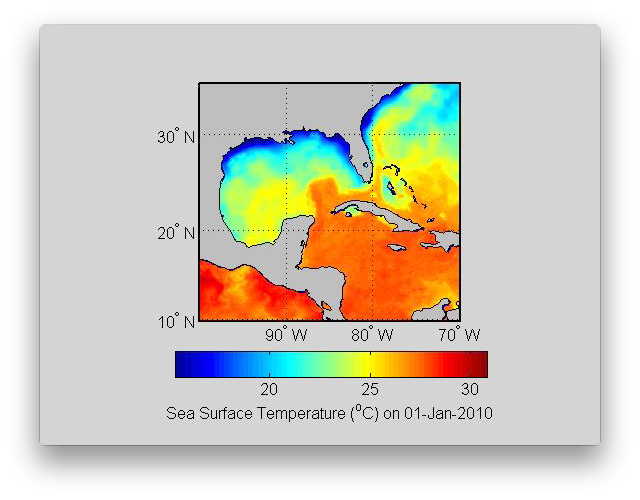 |
Figure 3.
The Loop Current is the strong flow that transport warm water into the Gulf of Mexico from the Caribbean Sea and it feeds the Florida Current. The thermal signature of the the Loop Current is most visible in the spring, e.g. at the end of April. The animation shows the Loop Current becoming a more closed circulation at the end of May that pinches off leading to the formation of a large Loop Current Eddy named "Franklin". This process occurs every 9 to 13 months. In the summer
month, the Gulf of Mexico becomes very warm and it is hard to observe the
Loop Current using SST data. The Loop Current is observed again in October.
The northward penetration of the Loop Current varies throughout the year.
( Click the thumbnail to play the animation. )
|
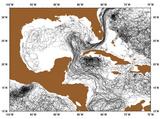 |
Figure 4.
|
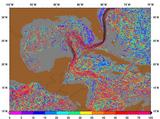 |
Figure 5.
|
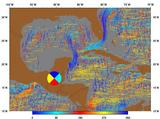 |
Figure 6.
|
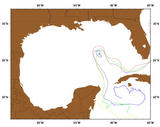 |
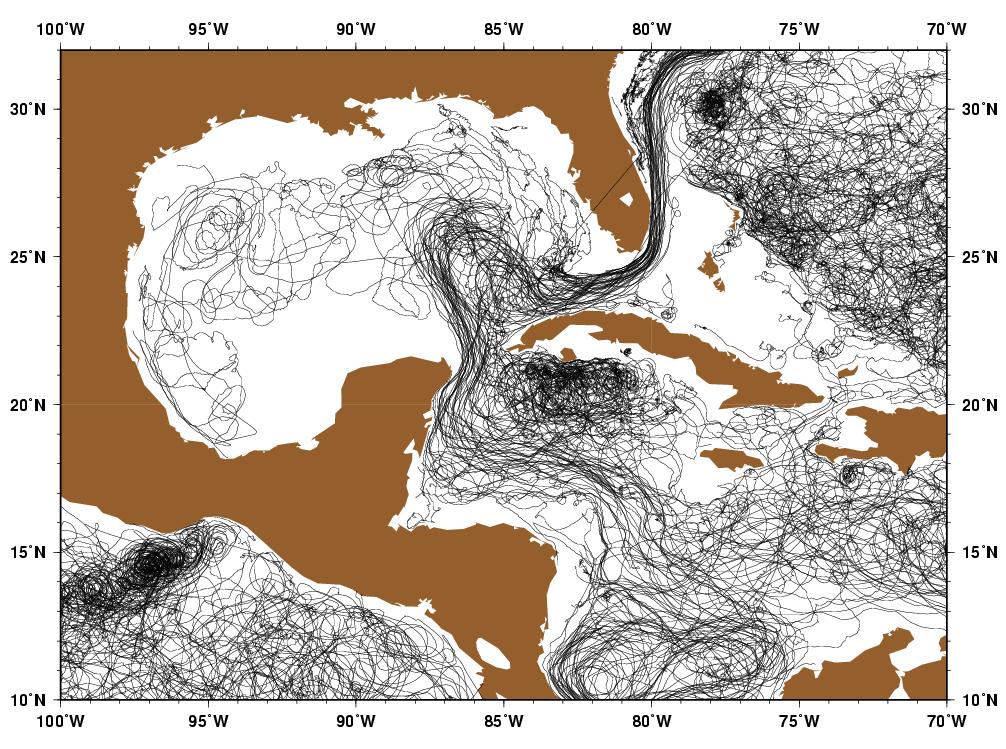
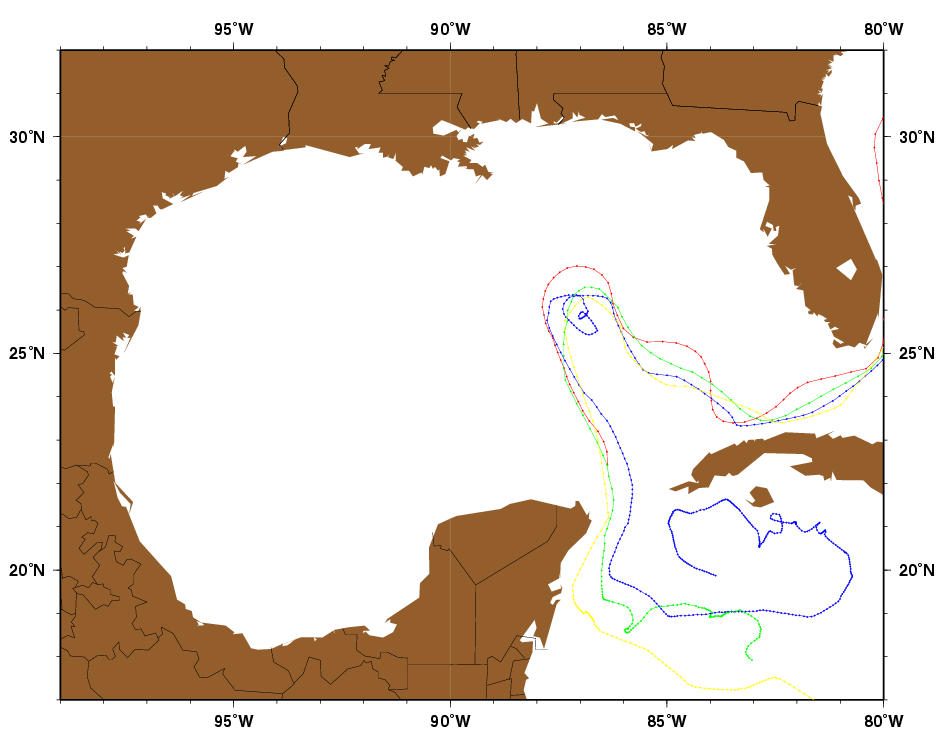
Figure 7.
The trajectory of near-surface drifters that show the same circulation
pattern as discussed in Figure 1. Though these four drifters were launched
in very different locations in the subtropical Atlantic and Caribbean Sea
they all ended up in the Loop current with very similar trajectories
and near 25°N, the drifters all flow through basically the same small
region off of the Florida Keys.
|
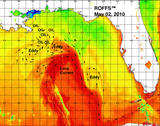 |
Figure 8.
An image of the sea surface temperature in the Gulf of Mexico.
Red colors are water with surface temperatures near 80 °F (27 °C)
and are associated with the Loop Current.
The image also shows small cyclonic eddies that are common in this region.
This is an analysis by ROFFs for monitoring the 2010 oil spill and
the image is courtesy of Dr. Mitch Roffer
(ROFFS).
|
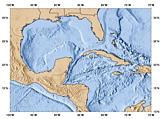 |
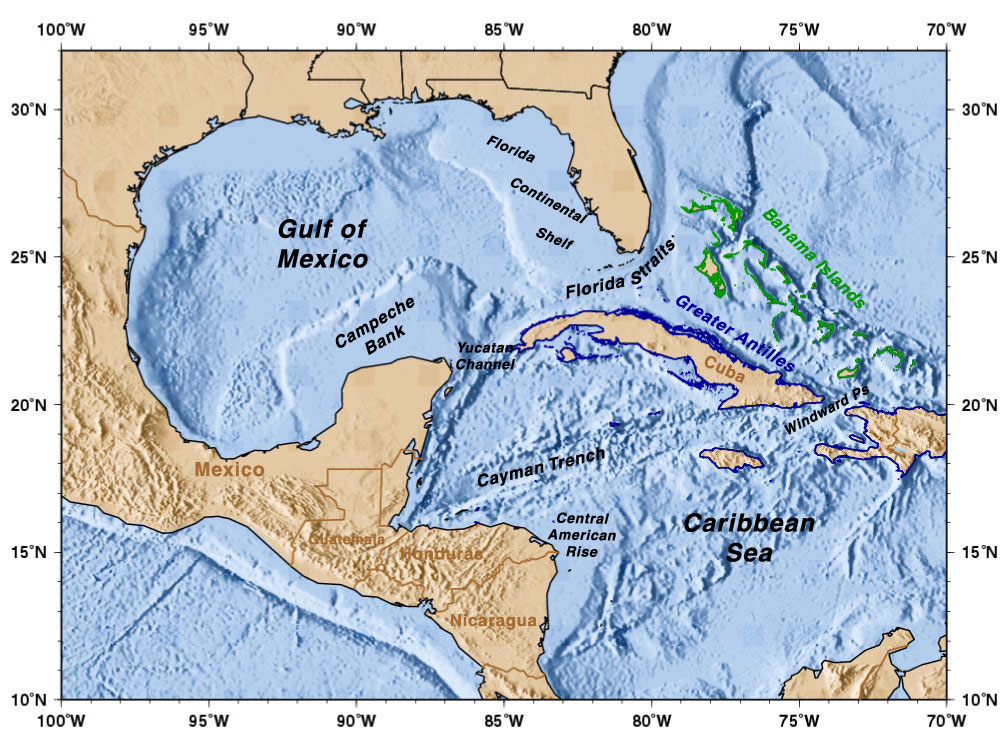
Figure 9.
Geography of the region.
|
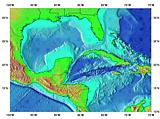 |
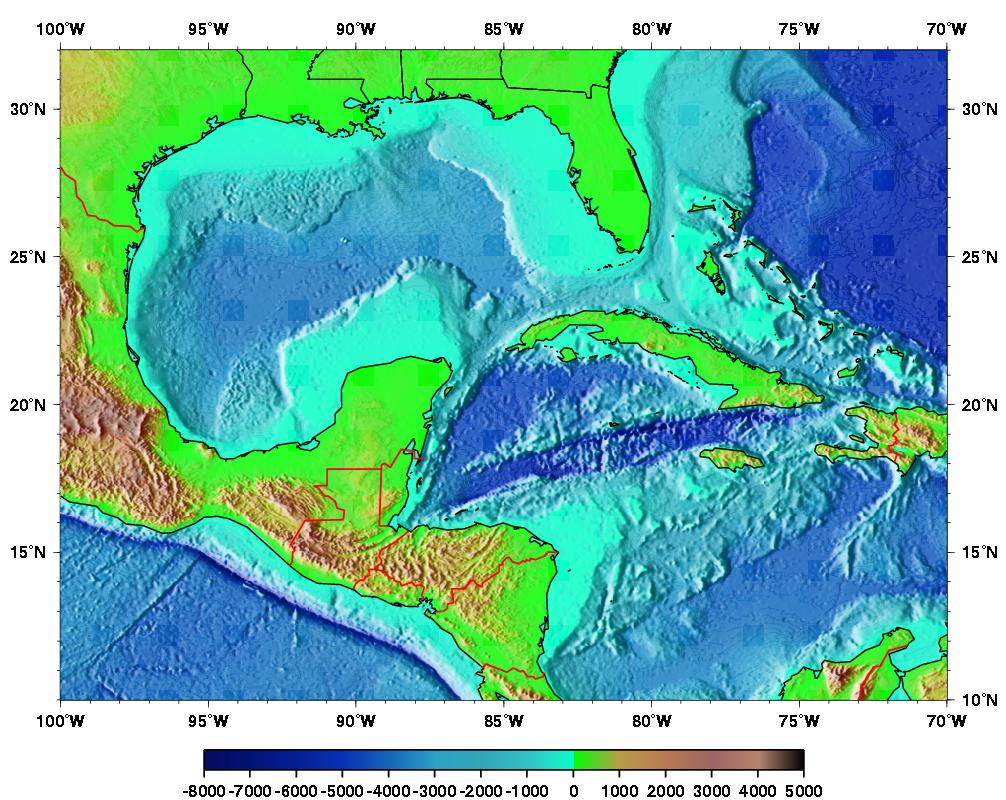
Figure 10.
Topography/Bathymetry of the region.
|
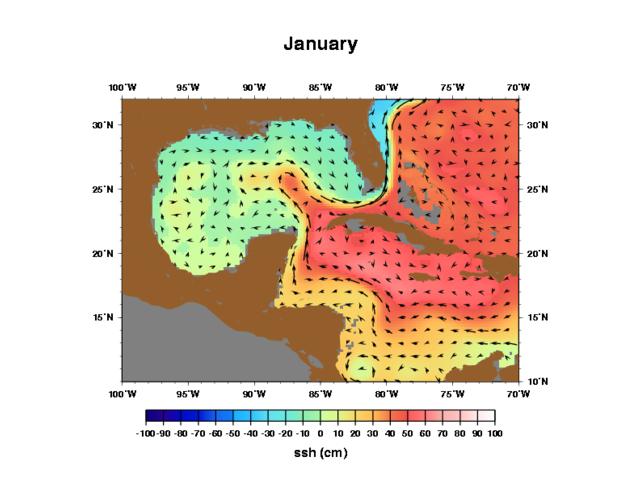 |
Figure 11.
The Loop Current as represented by the HYCOM Model.
This figure shows the sea surface velocity and sea surface height anomilies
for January.
Click here for example plots of
monthly averages
including slide shows and side-by-side comparisons with MGSVA velocities.
|
 |
Figure 12.
A SST map illustrating the large extent of the Loop
Current into the Gulf of Mexico. This SST map is from
February 19-20, 1996. Also evident is the Florida Current, offshore
of the east coast of Florida, cool coastal waters around the
Gulf Coast states and northern Florida, and a warmer filament
of surface water being wrapped around the Loop Current indicating
that a Loop Current Ring will probably detach from the current.
|