 |
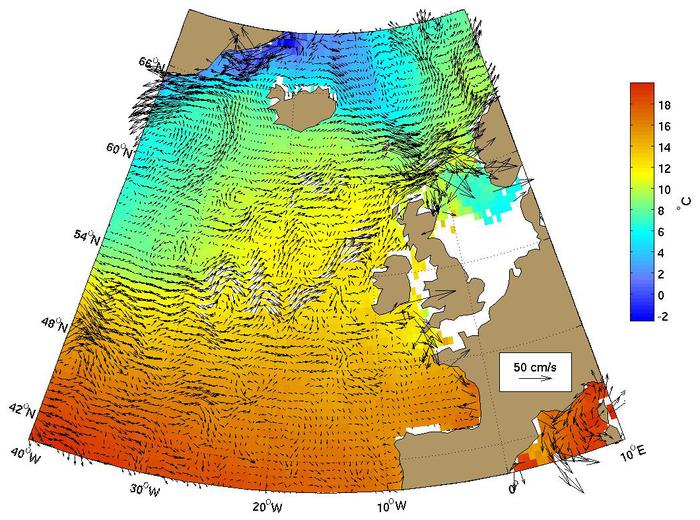
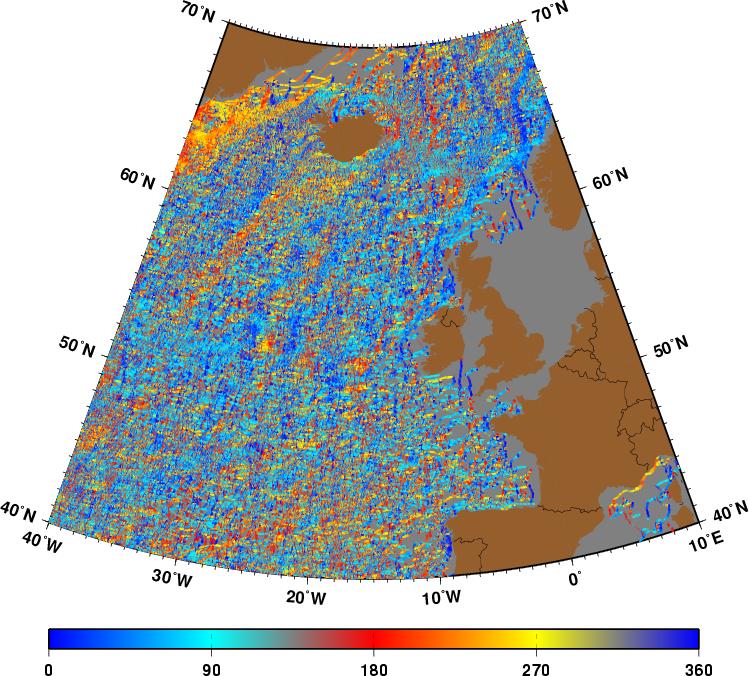
Figure 1.
The North Atlantic drift as represented by the Mariano Global Surface
Velocity Analysis (MGSVA). The N. Atlantic drift is the broad, northward
flow of surface waters that replaces the sinking waters in the N.
Atlantic polar seas.
Click here for example plots of
seasonal averages.
|
|
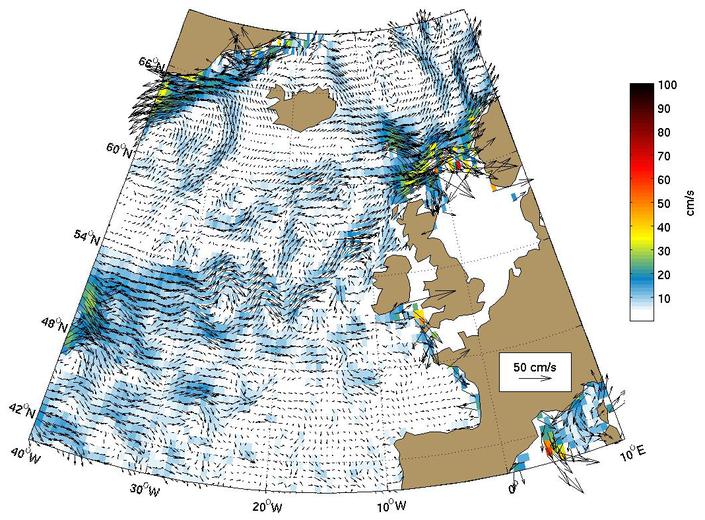
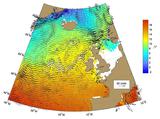
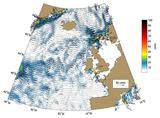
Figure 2.
Global Ocean Surface Velocities from Drifters
(top panel w/ SST, bottom panel w/ Speed)
Figure Caption is Under Construction.
Click here for example plots of
seasonal averages.
|
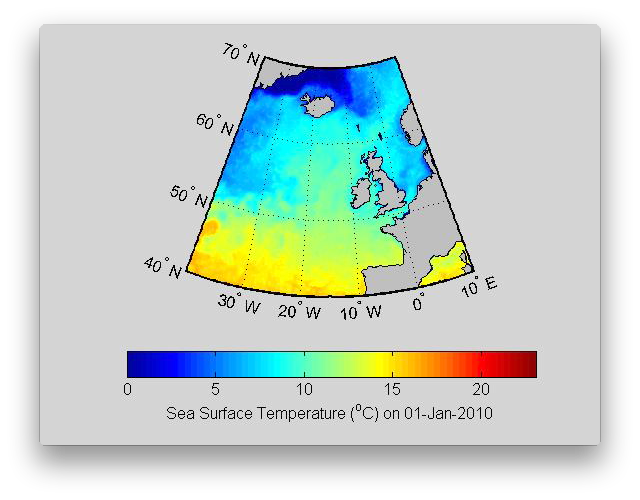 |
Figure 3.
North Atlantic Drift is a relatively slow, broad flow that transports warm water
northward in the Northeast Atlantic. This transport is most visible during the
summer in the SST animation. It is important for bringing waters from the northern
subtropical gyre flow to subpolar regions and feeding the Slope/Shelf Edge
Current between the Shetland Islands and the Faroe Islands.
( Click the thumbnail to play the animation. )
|
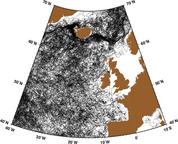 |
Figure 4.
|
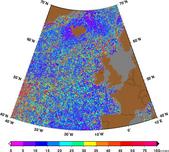 |
Figure 5.
|
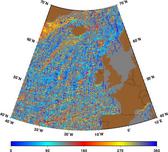 |
Figure 6.
|
 |
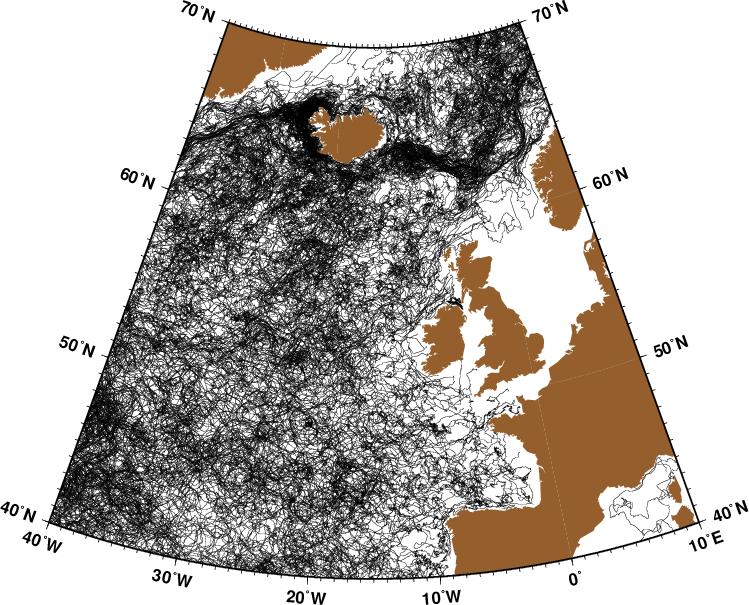
Figure 7.
Trajectories of buoys ID 03280 (red), 08521 (green), and 16217 (blue)
illustrate the slow net northward/northeastward drift of the North
Atlantic Current. Buoy 08521 travels from 50°N, 25°W to 60°N,
15°W in about one year. It then is in the Slope Current during June
of 1994. The net speed of buoy 08521 is similar to that of buoy 08521
and is representative of the North Atlantic Drift. Buoy 16217 is a good
example of how water brought north by the North Atlantic drift is
entrained into the cold Norwegian Current during the fall of 1994.
|
 |
Figure 8.
AVRRR image of the sea-surface temperature (SST).
|
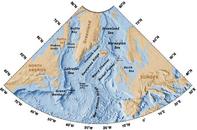 |
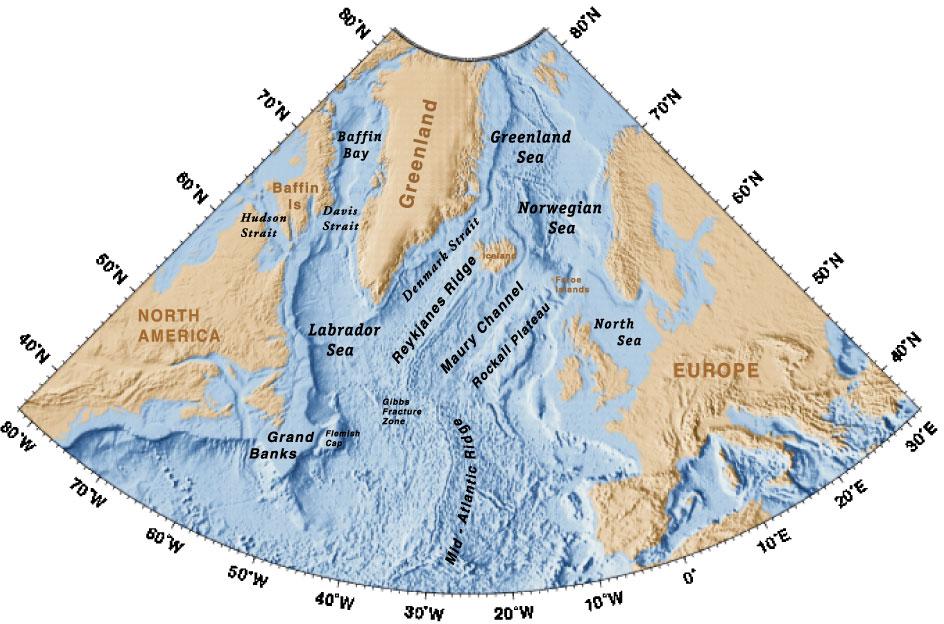
Figure 9.
Geography of the region.
|
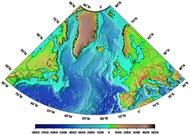 |
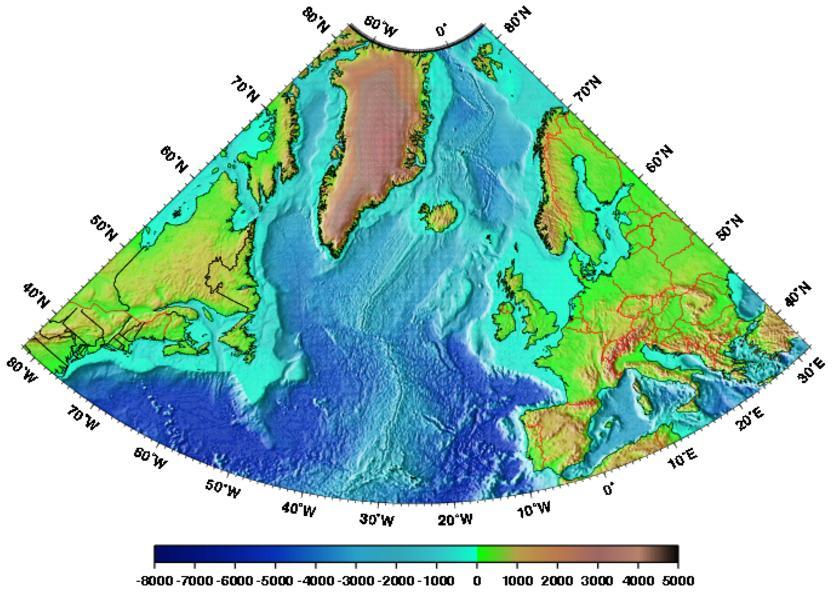
Figure 10.
Topography/Bathymetry of the region.
|