Please be patient while this page loads, Thanks!
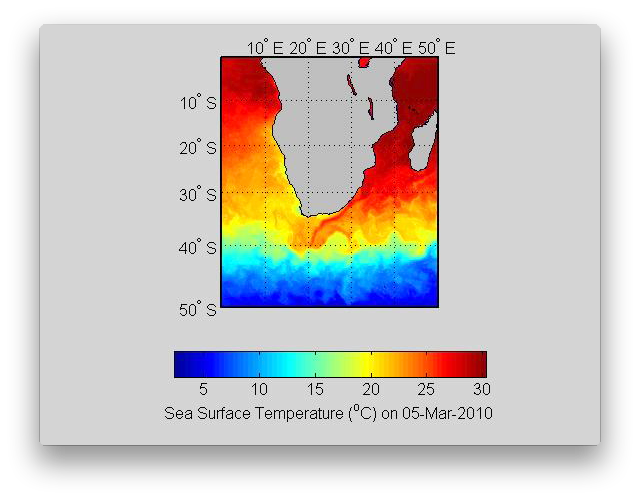
Agulhas
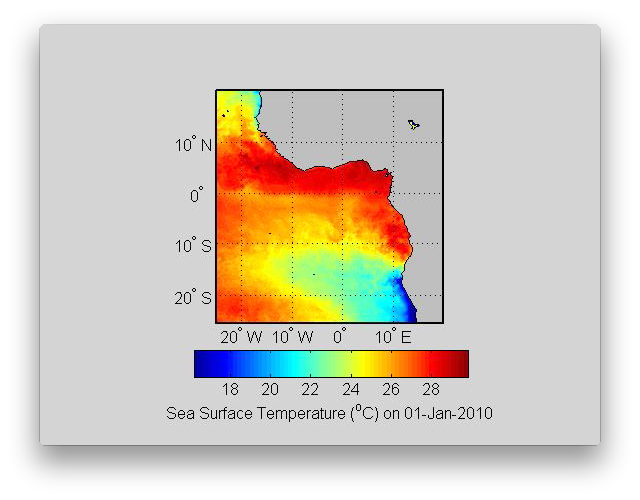
Angola
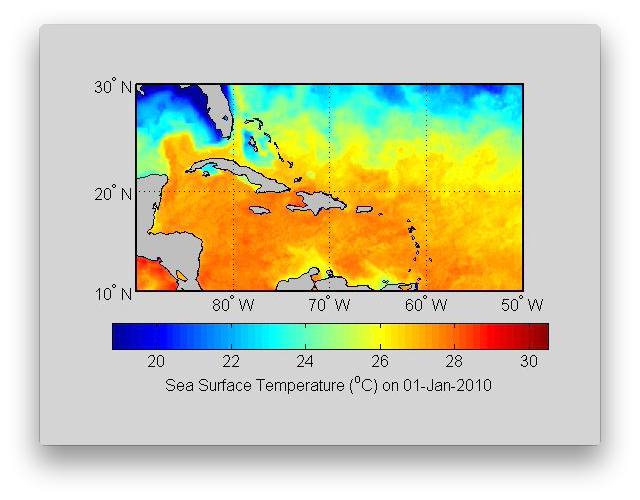
Antilles
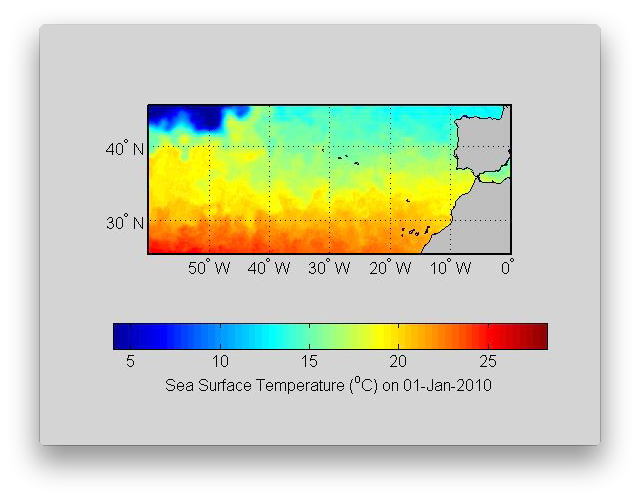
Azores
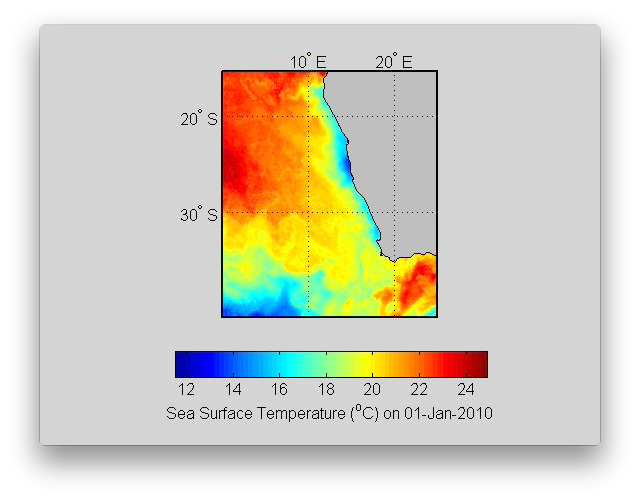
Benguela
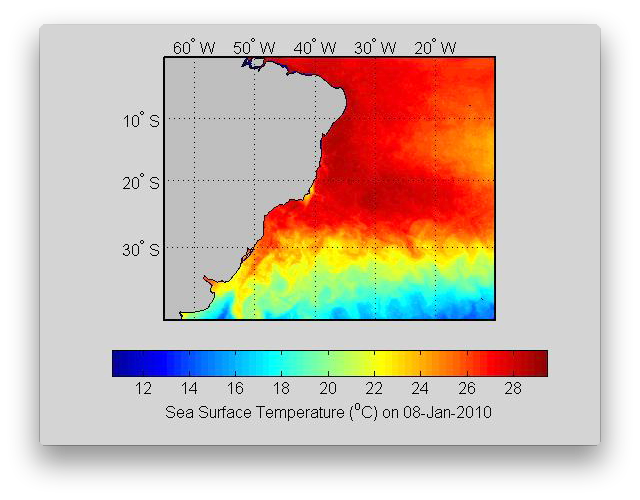
Brazil
Canary
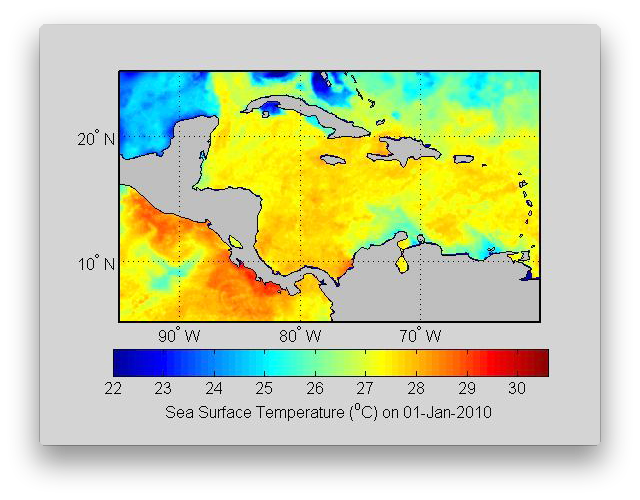
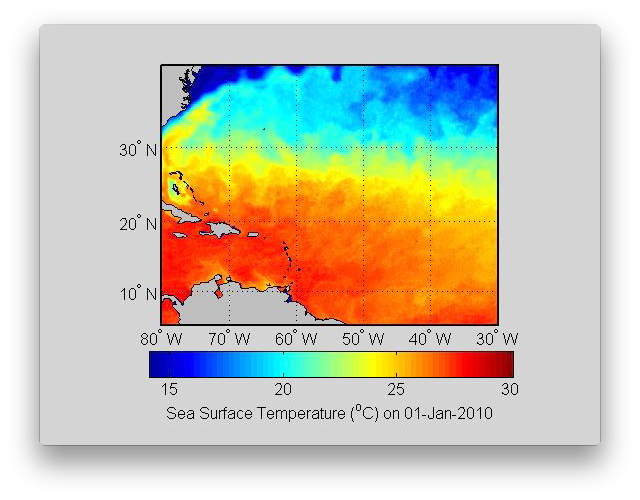
Caribbean
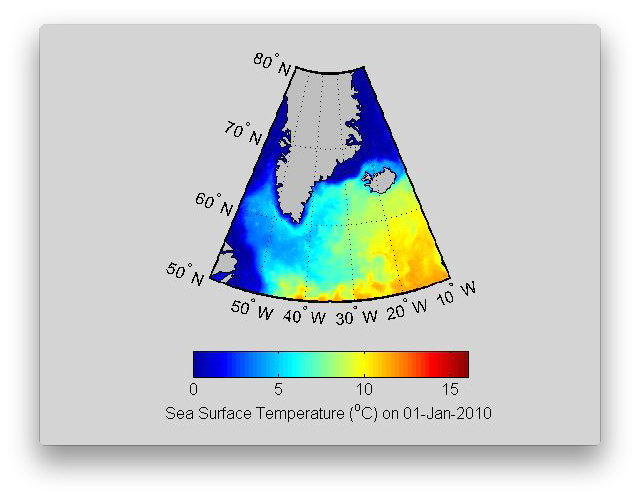
East Greenland
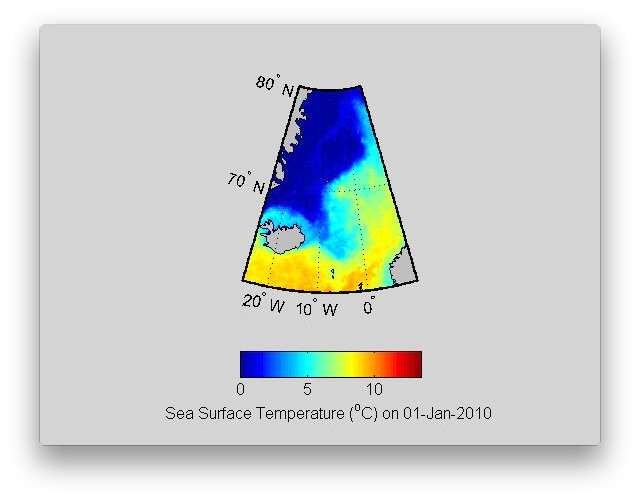
East Iceland
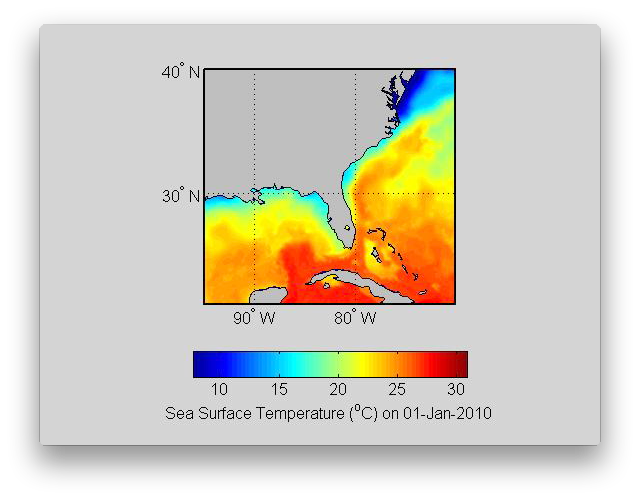
Florida
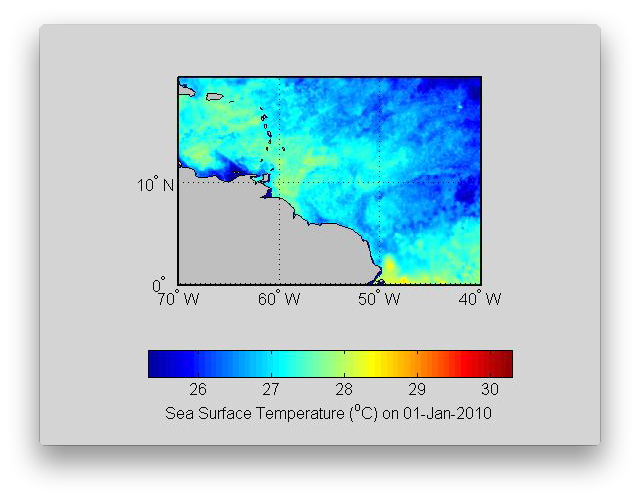
Guiana
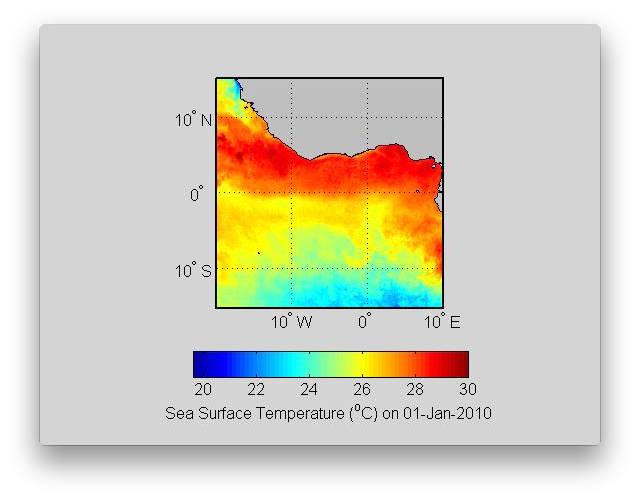
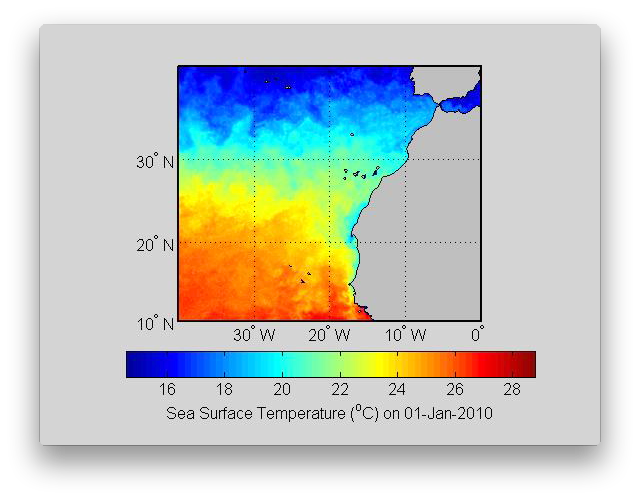
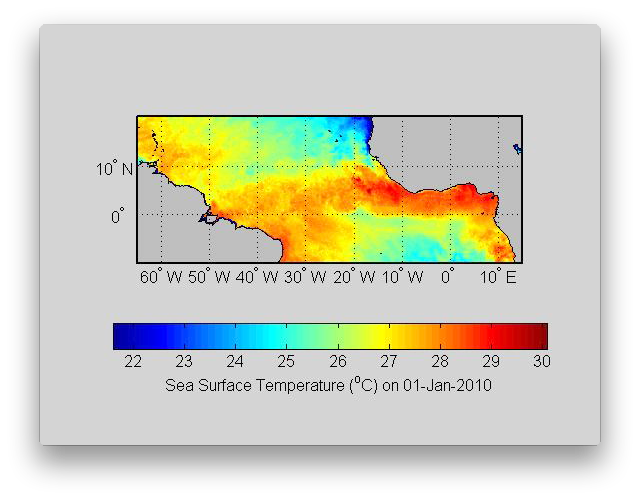
Guinea
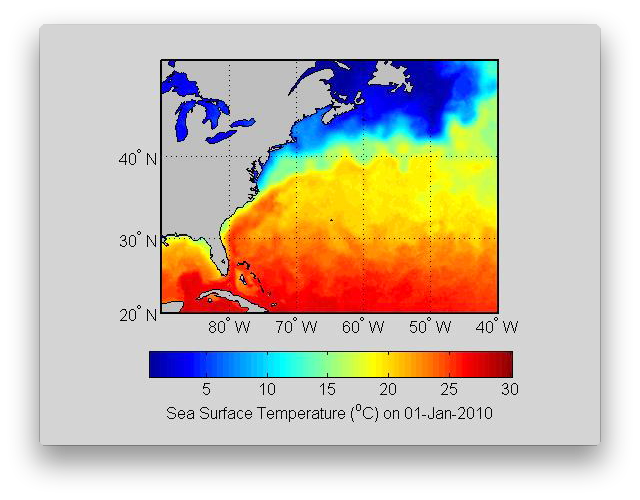
Gulf Stream
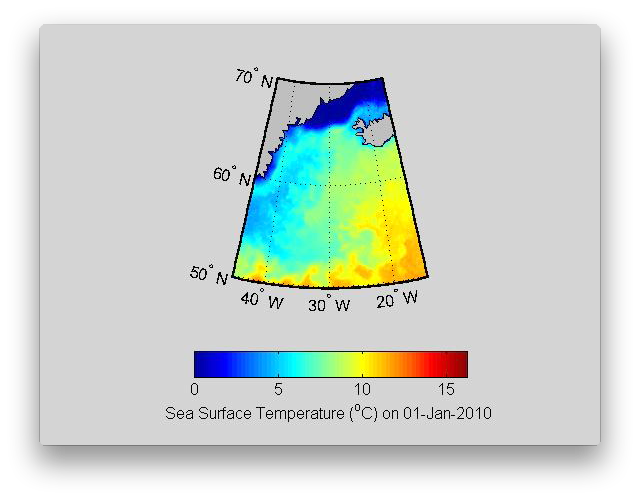
Irminger

Labrador
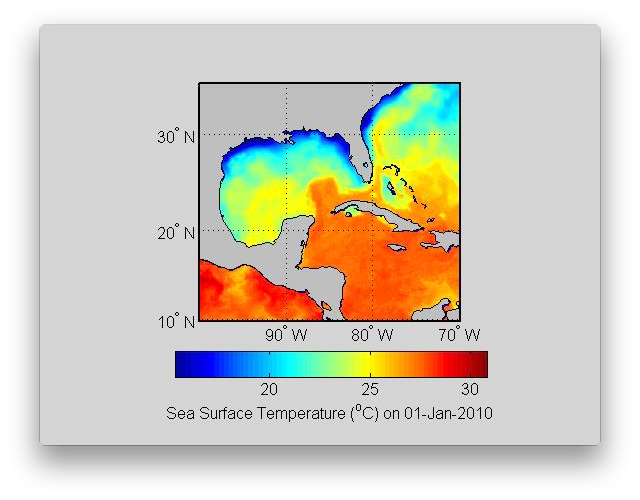
Loop
Malvinas
North Atlantic Drift
North Atlantic
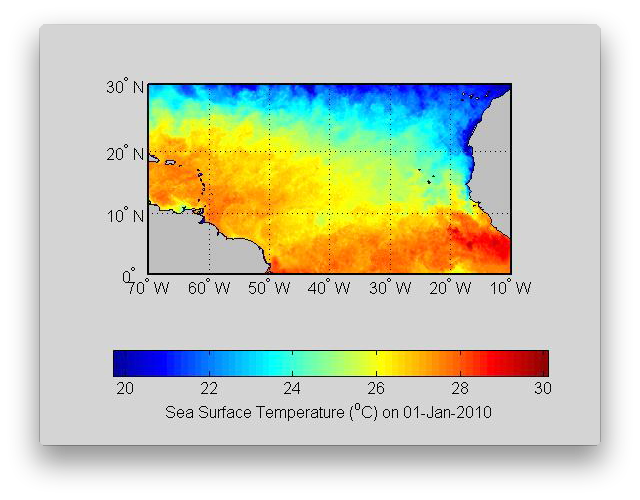
North Brazil
North Equatorial CC
North Equatorial
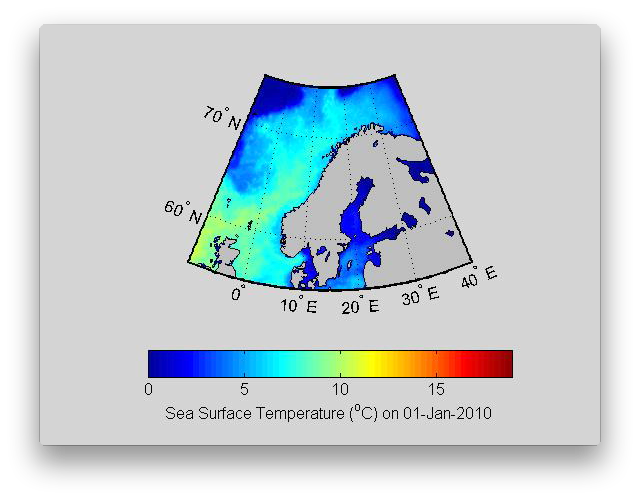
Norwegian
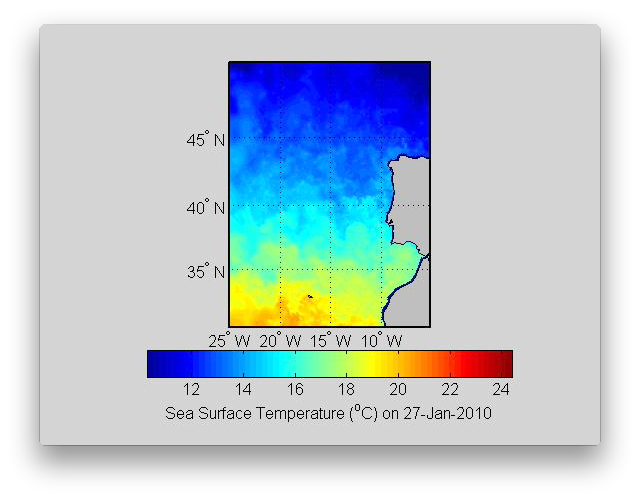
Portugal
Slope
Slope Jet
South Atlantic

South Equatorial Sys
Spitsbergen
Subtropical CC
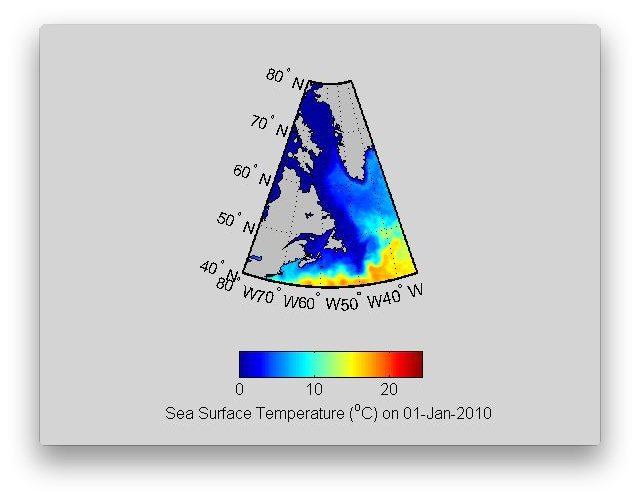
West Greenland