 |
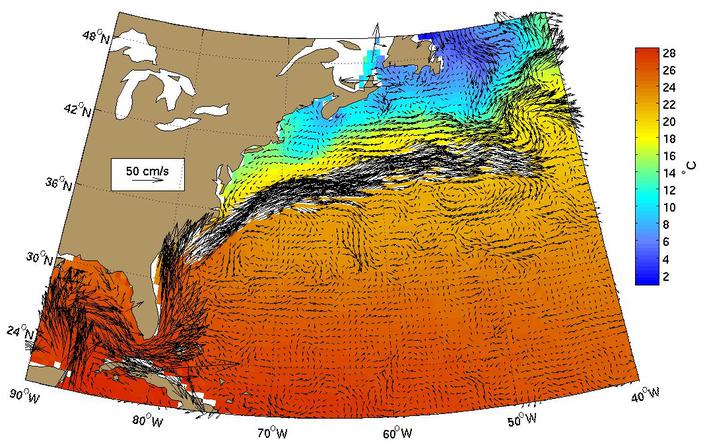
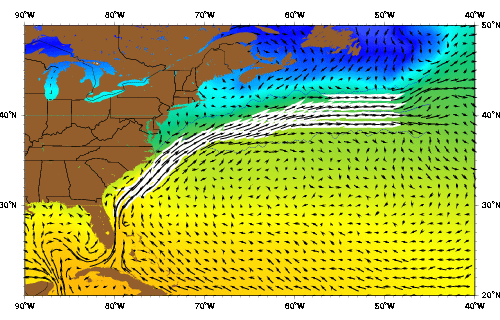
Figure 1.
The Gulf Stream as represented by the Mariano Global Surface Velocity
Analysis (MGSVA). The Gulf Stream is the western boundary current of the
N. Atlantic subtropical gyre. The Gulf Stream transports significant amount
of warm water (heat) poleward. The averaging of velocity data from a
meandering current produces a wide mean picture of the flow. The core of
the Gulf Stream current is about 90 km wide and has peak velocities of
greater than 2 m/s (5 knots).
Click here for example plots of
seasonal averages.
|
|
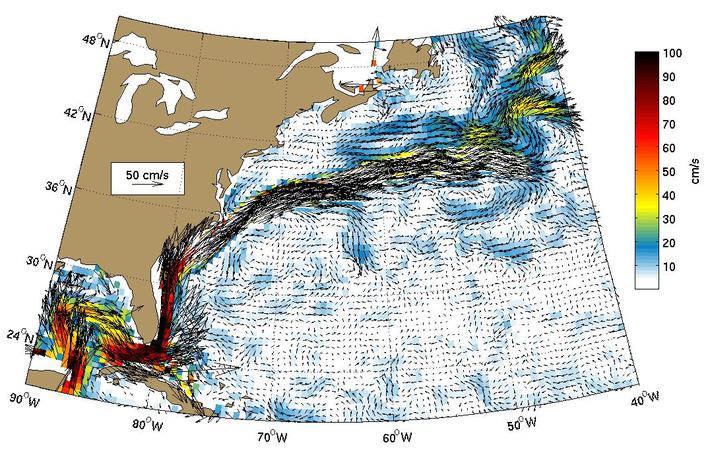
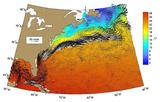
Figure 2.
Global Ocean Surface Velocities from Drifters
(top panel w/ SST, bottom panel w/ Speed)
Figure Caption is Under Construction.
Click here for example plots of
seasonal averages.
|
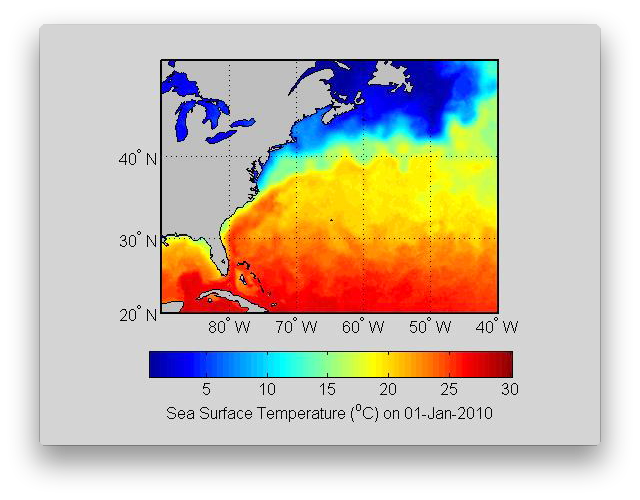 |
Figure 3.
The Gulf Stream is a temperature front that has significant meanders. Warm water pulses are seen in mid-March, for example, with a net movement to the east/northeast. As the meanders grow and rings are formed. A cold core ring can be seen at the end of May near 63°W and 35°N and a warm core ring near 65°W and 39°N in early June and at the end of October.
( Click the thumbnail to play the animation. )
|
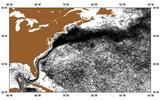 |
Figure 4.
|
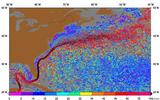 |
Figure 5.
|
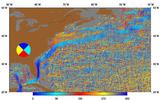 |
Figure 6.
|
 |
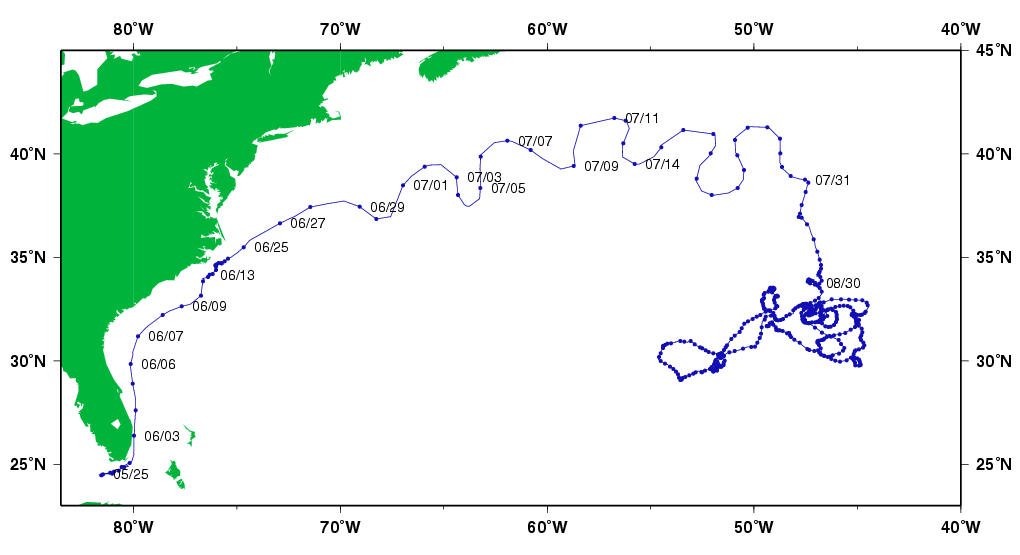
Figure 7.
The trajectory of a holey-sock drifter drogued at 10 m depth. Launched
off of the Florida Keys (05/25) by Tom Lee, the drifter is entrained by
the Florida Current, its path is deflected by the Charleston Bump (06/09)
and it meanders in the Gulf Stream (06/29-07/29). After leaving the stream
east of 50°W, it exhibits eddy motion (08/30) and a slow drift to the
south/west before its death thirteen months later in September of the next
year.
|
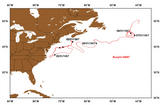 |
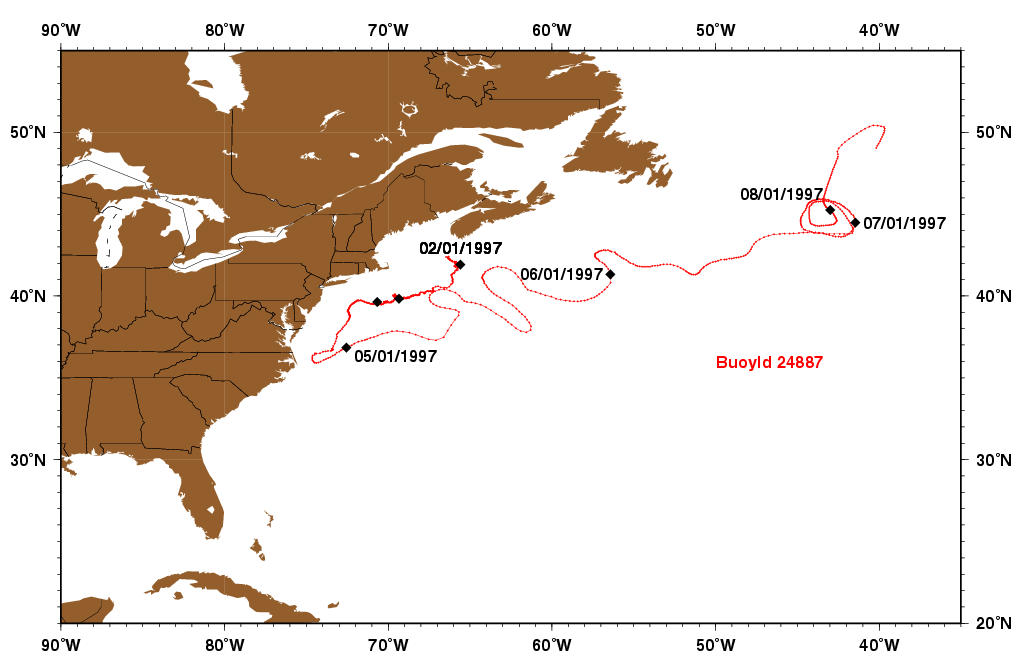
Figure 8.
Buoy 24887 moves south, in the slope water, in early 1997 before being
entrained into the Gulf Stream, east of Cape Hatteras, in April of 1997.
The buoy is advected quickly eastward by the Gulf Stream, and two months
later, after a number of meanders, the buoy is near 42°W. In contrast
to the buoy trajectory in figure 6, this buoy goes north into the
North Atlantic Current.
|
 |
Figure 9.
AVRRR image of the sea-surface temperature (SST).
|
 |
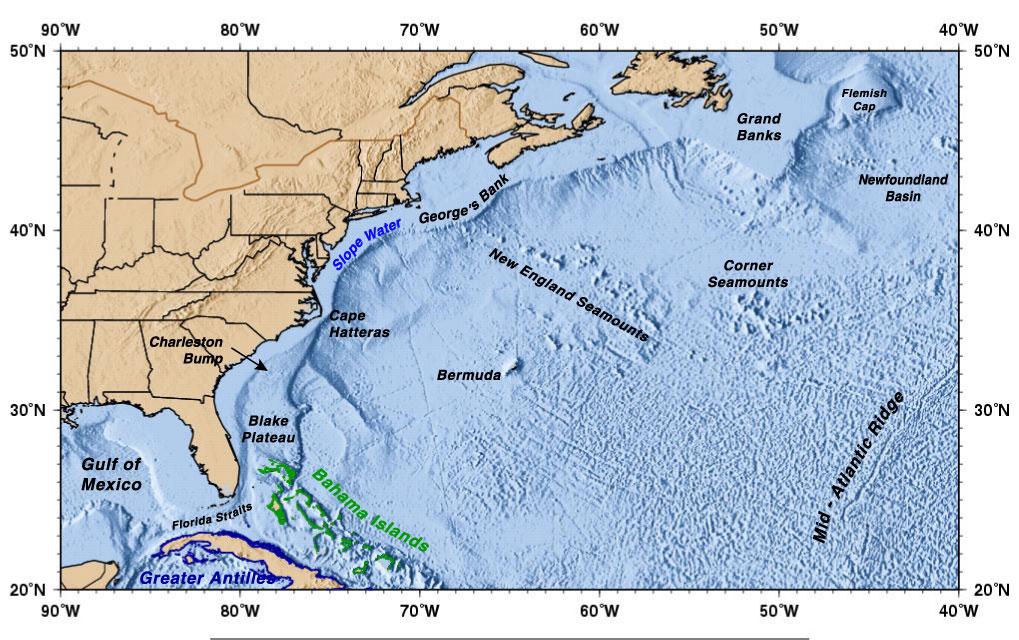
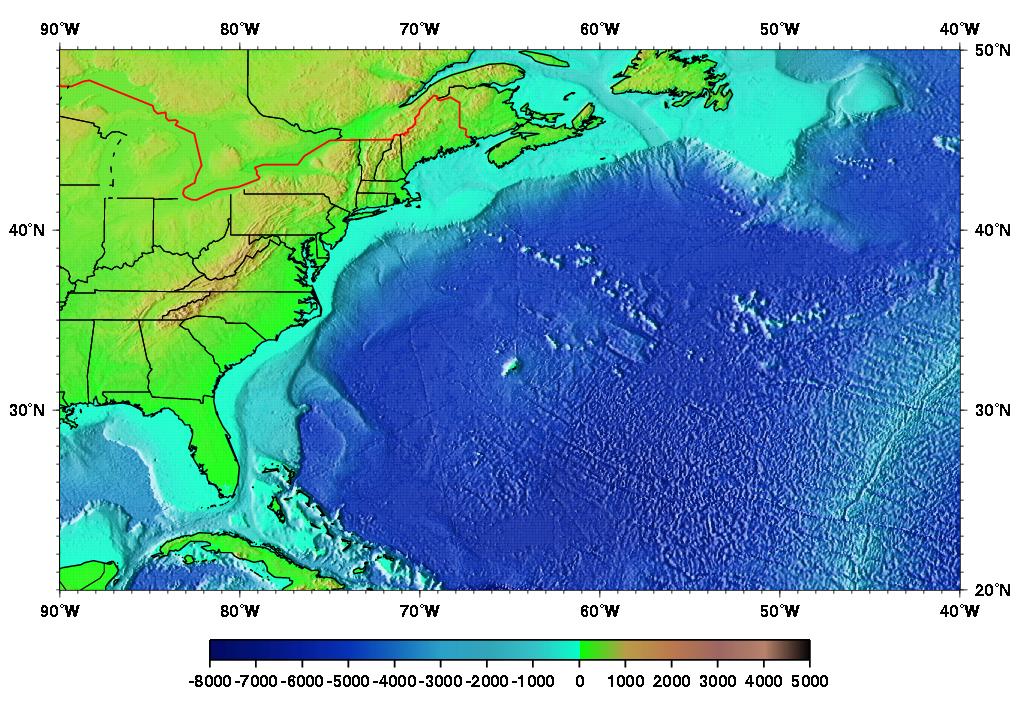
Figure 10.
Geography of the region.
|
 |
Figure 11.
Topography/Bathymetry of the region.
|
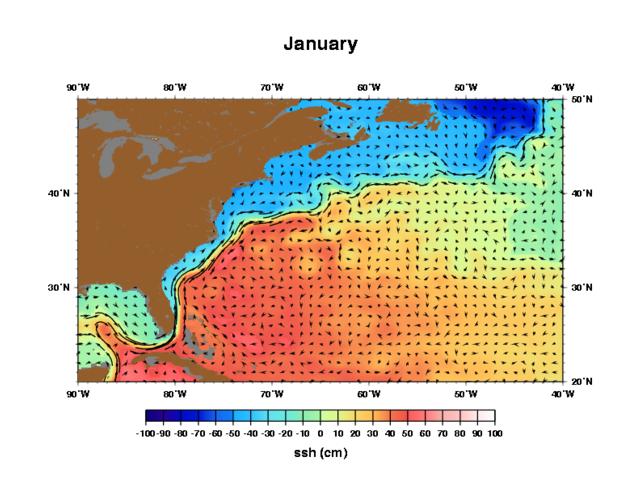 |
Figure 12.
Output from a high-resolution HYCOM Model simulation of the tropical
and North Altantic ocean circulation are plotted here for the Gulf
Stream system. Sea surface velocity vectors are superimposed on sea
surface height fields for the month of January. The large-scale high
pressure system is the N. Atlantic subtropical gyre. Mesoscale eddies,
whose diameters are on the order of 200 km, are visible as "circular"
sea surface height anomalies.
Click here
for a complete set of plots of monthly averages, slide shows, and
side-by-side comparisons with MGSVA velocities.
|
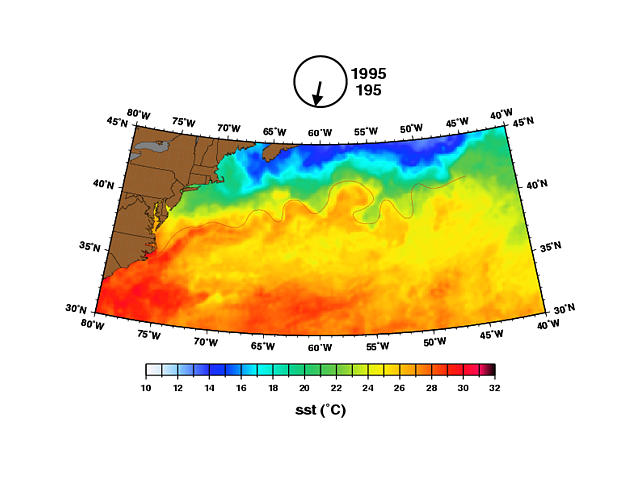 |
Figure 13.
A satellite-derived Sea Surface Temperature map, constructed from
space-time interpolation of three weeks of images and in situ data, for
July 14, 1995 showing the Gulf Stream ring and meander region. The
black line is the Gulf Stream Northern Edge that was calculated using
the methods described in Chin and Mariano (1997) and is based on
space-time interpolation of digitized contours from two-day composites.
(This figure was submitted in a paper to J. Physical
Oceanography).
|
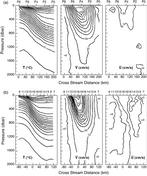 |
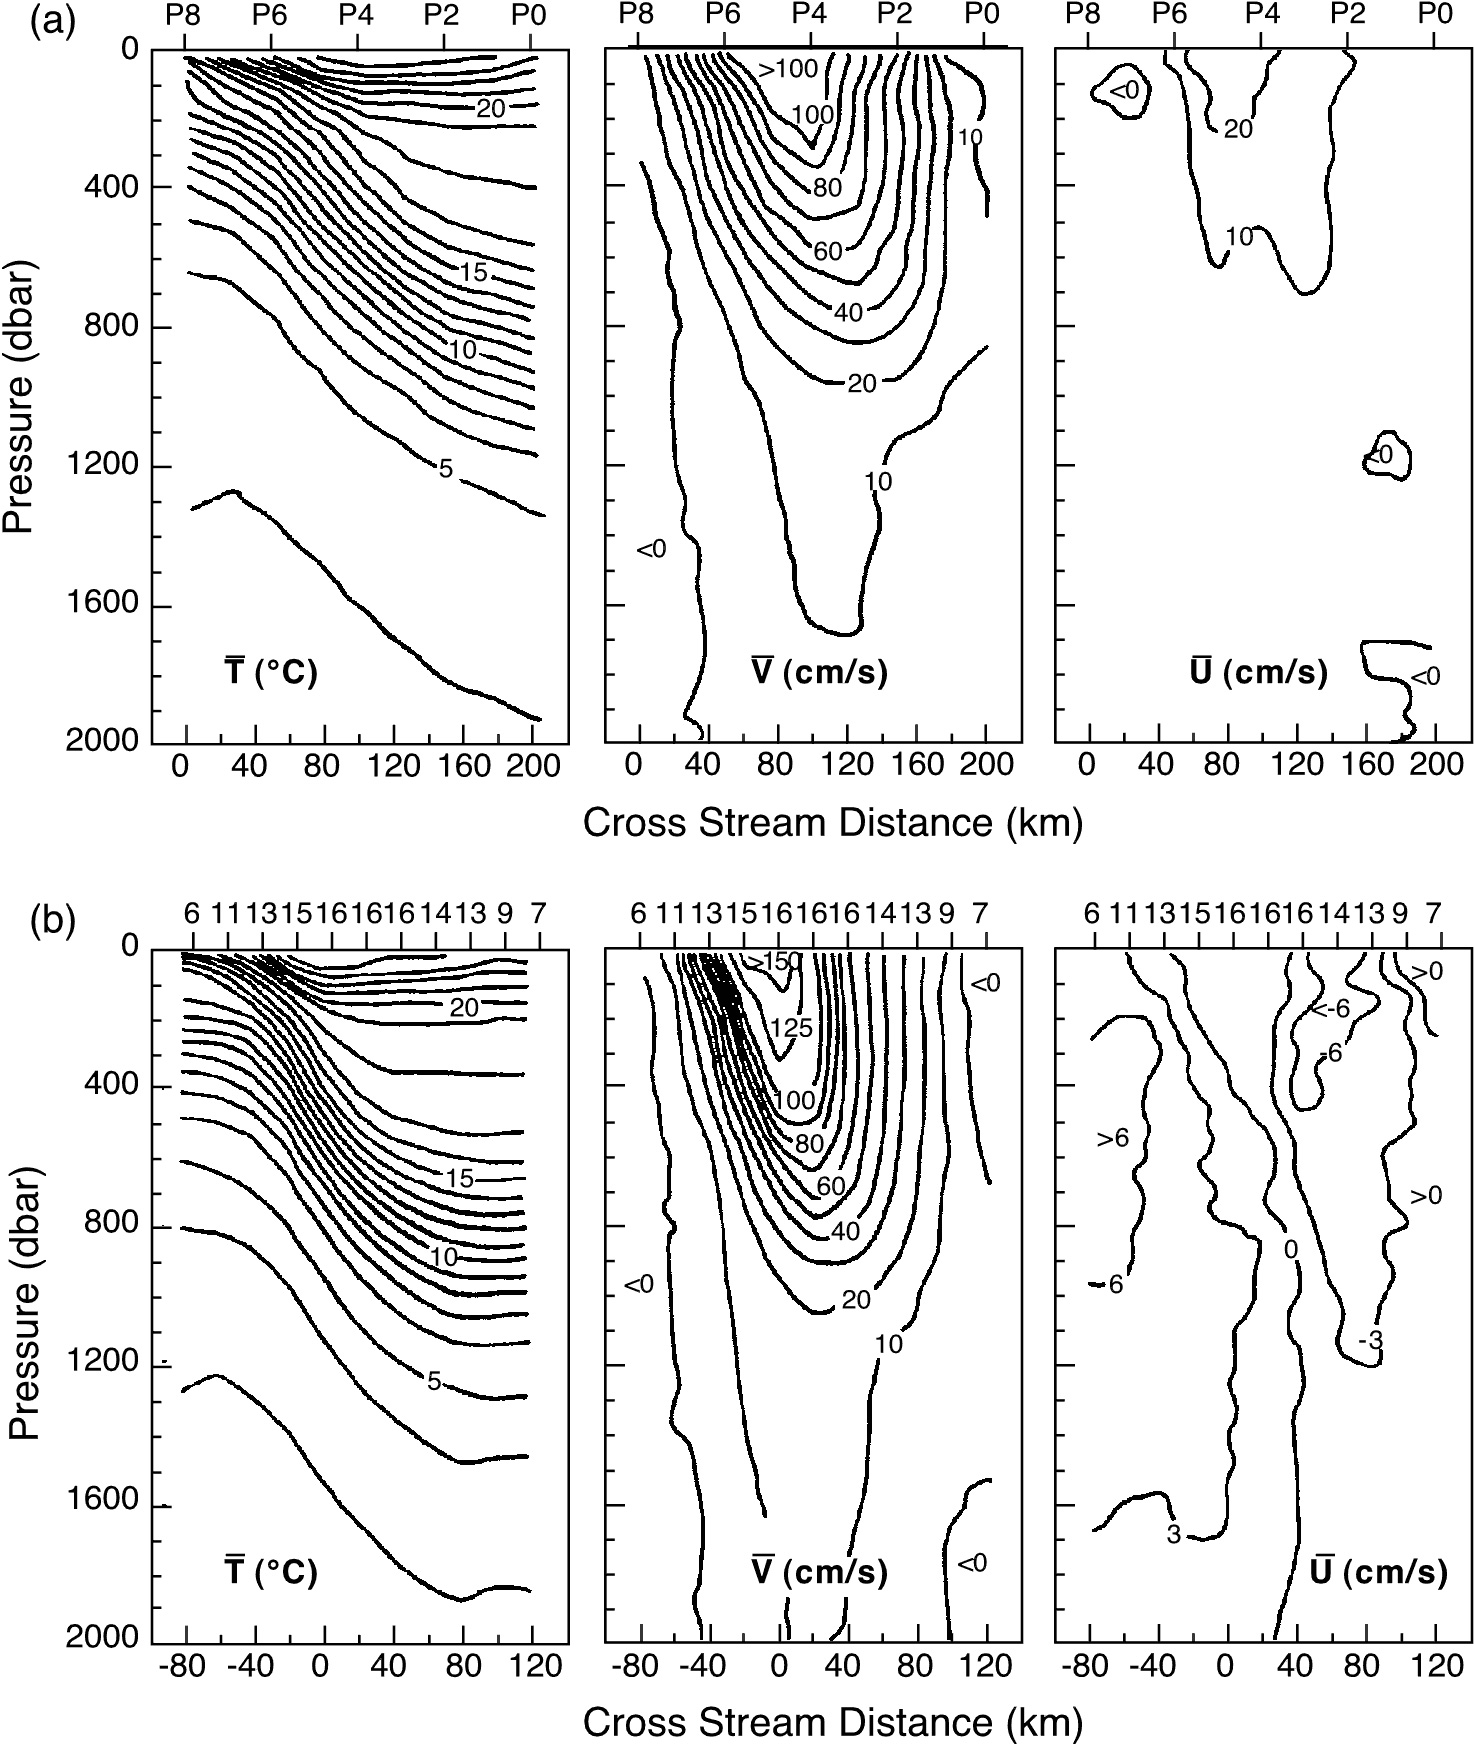
Figure 14.
(a) Average temperature and velocity transects, as a function of
cross-stream distance and depth from the surface to 2000 m, from repeated
surveys of the Gulf Stream near 73°W, calculated by averaging the data
at each of the nine PEGASUS acoustic profiler stations, P0,P1,... ,P8.
(b) A stream-based average for the same data that was used to generate (a).
Zero cross-stream distance is defined to be the high velocity core of the
stream. Note that the high velocity core for the stream-averaged data is 50%
greater than the average calculated at fixed positions. The difference in
the two averages is primarily due to the large-scale meandering of the
Gulf Stream. The number of Pegasus profiles used in the average is given
above the lower set of plots. Features worth noting are:
(i) the 18°C water, evident at depths between 200 and 500m and offshore
between P4 and P0, formed by winter-time convection in the Northwest Atlantic;
(ii) the near-surface steep sloping isotherms associated with strong current
shear in the inshore (negative cross-stream distance) side of the stream;
(iii) the asymmetric velocity core with less current shear in the offshore
side of the stream and with the maximum velocity occurring progressively
further offshore with depth; and
(iv) the 10-20 cm/s flow at depths of 2000 m
(Based on a figure from Halkin and Rossby, 1985).
(633 kB).
|