 |
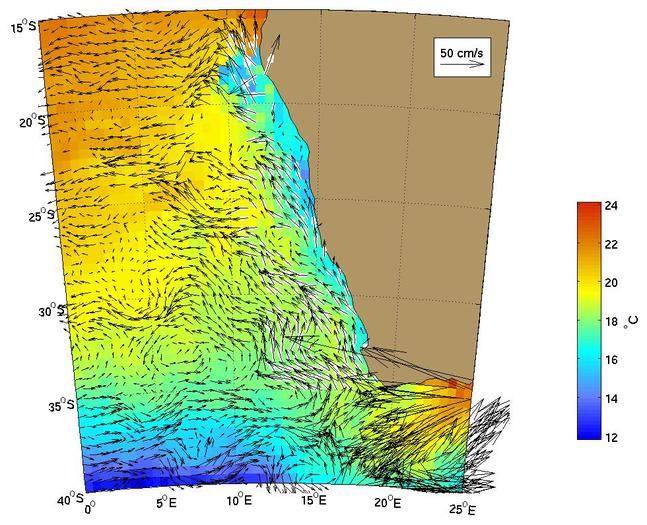
Figure 1.
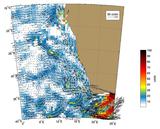
The Benguela current as represented by the Mariano Global Surface
Velocity Analysis (MGSVA). The Benguela Current is the eastern boundary
current of the South Atlantic subtropical gyre. The Benguela Current
flows through a strong, biologically productive upwelling region,
and advects cool waters to the tropics. This water is warmed and
is one of the source waters for the South Equatorial Current.
Click here for example plots of
seasonal averages.
|
|
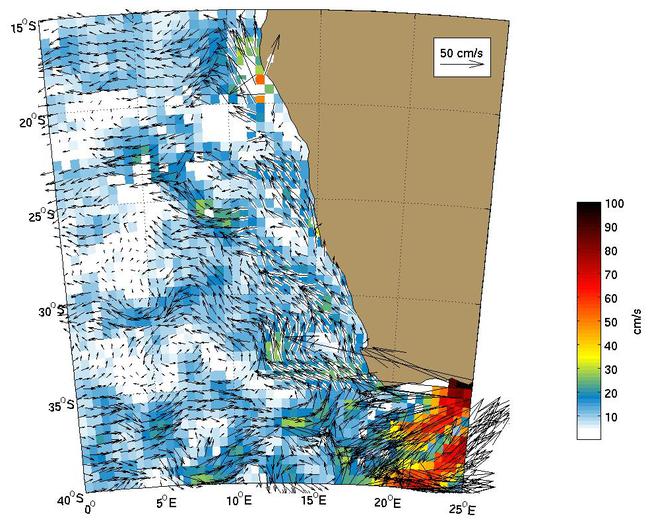
Figure 2.
Global Ocean Surface Velocities from Drifters
(top panel w/ SST, bottom panel w/ Speed)
Figure Caption is Under Construction.
Click here for example plots of
seasonal averages.
|
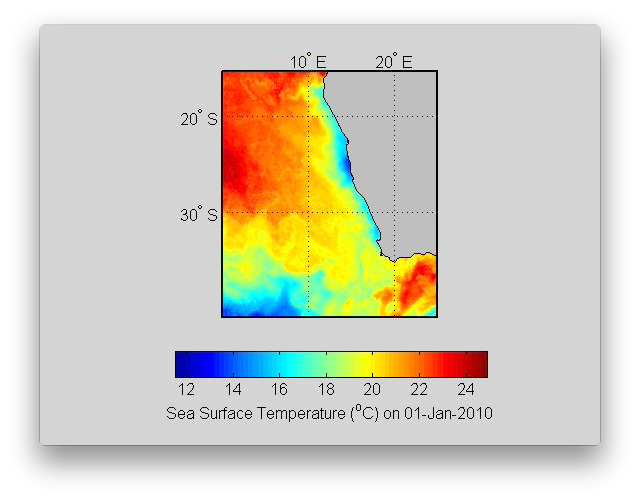 |
Figure 3.
The Benguela Current transports warm water to the north/northwest from offshore of the Cape of Good Horn into the interior of the South Atlantic. A good example of an Agulhas ring being transported by the Benguela Current is during April near 20°E and the southern region. Also evident is strong upwelling along the southwest coast of Africa due to Ekman transport. Eddies advect the coastal
water offshore into the Benguela Current.
( Click the thumbnail to play the animation. )
|
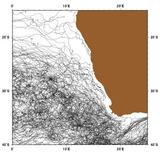 |
Figure 4.
|
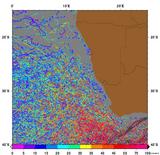 |
Figure 5.
|
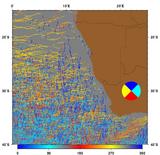 |
Figure 6.
|
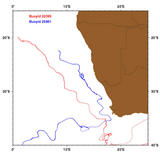 |
Figure 7.
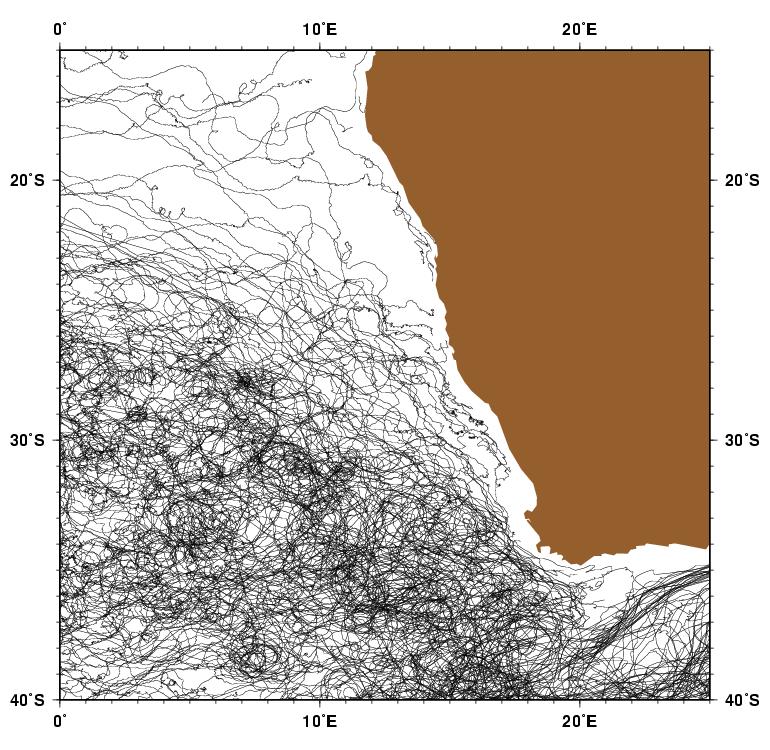
Trajectories of Buoy ID 22095 (red) and 25851 (blue) illustrate the
two primary pathways of source waters for the Benguela Current.
Buoy 22095 (red) indicates that the Indian Ocean waters, via
the Algulhas Current and its rings, are advected northwestward by
the Benguela Current. Buoy 25851 (blue) is one of the examples of
buoys in the cool South Atlantic Current that are advected, into
the tropical South Atlantic, by the Benguela Current.
|
 |
Figure 8.
AVRRR image of the sea-surface temperature (SST).
|
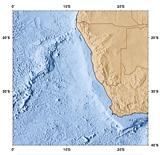 |
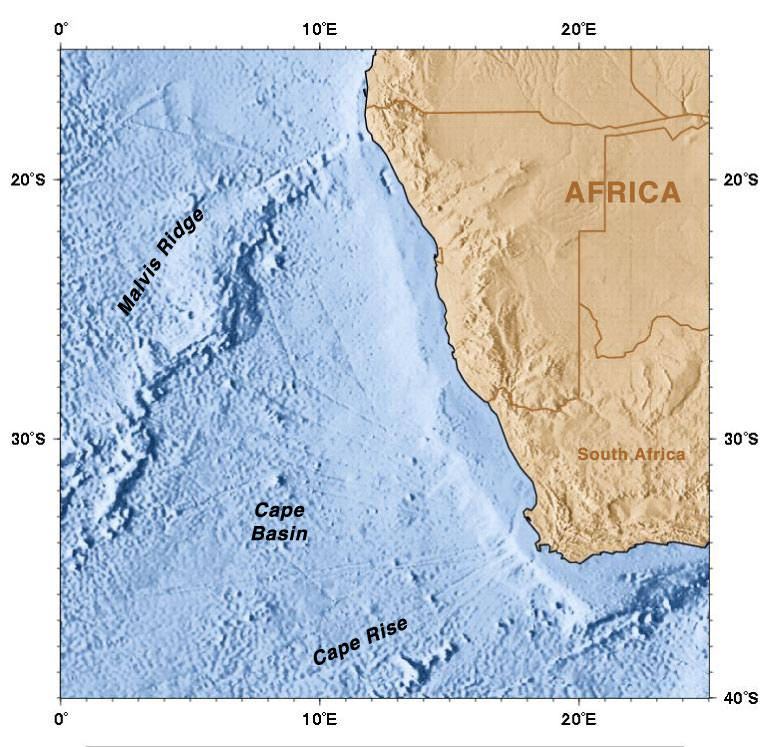
Figure 9.
Geography of the region.
|
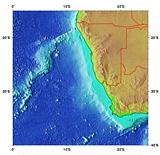 |
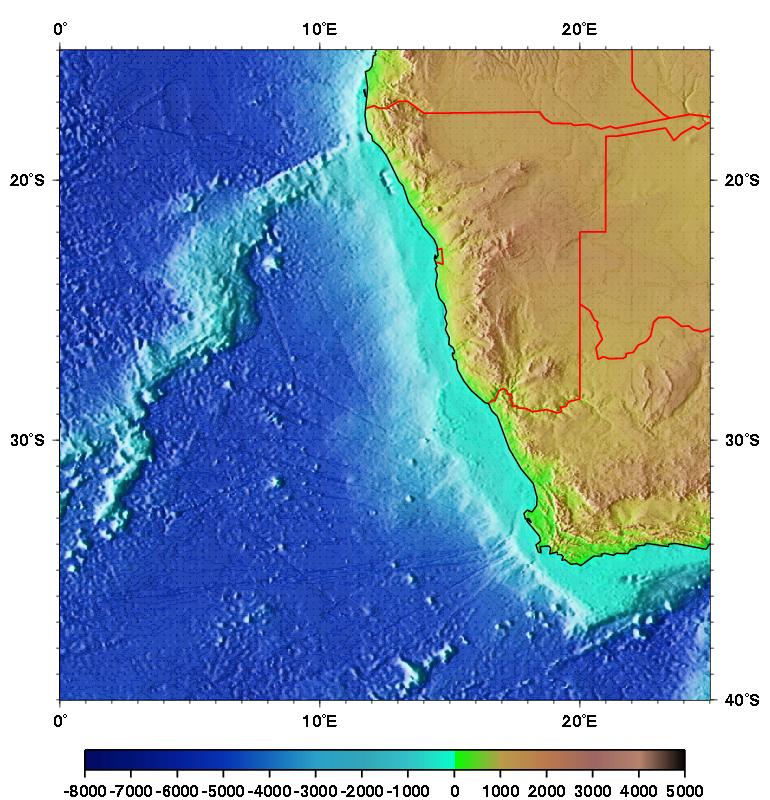
Figure 10.
Topography/Bathymetry of the region.
|