 |
Figure 1.
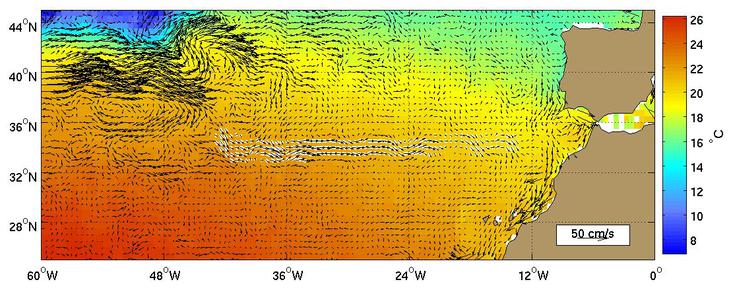
The Azores current as represented by the Mariano Global
Surface Velocity Analysis (MGSVA). The Azores current is the
southeastward flow component of the North Atlantic subtropical gyre.
The southernmost highlighted velocities are also known as the Portugal Current.
Click here for example plots of
seasonal averages.
|
|
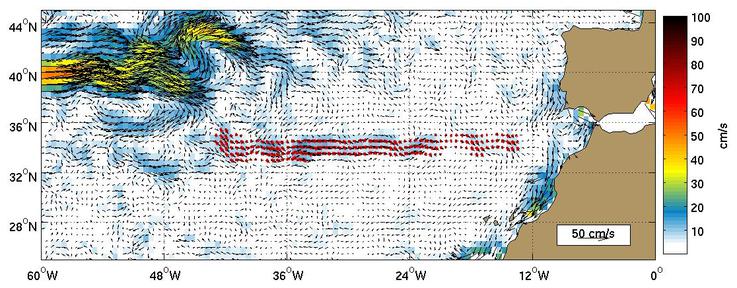
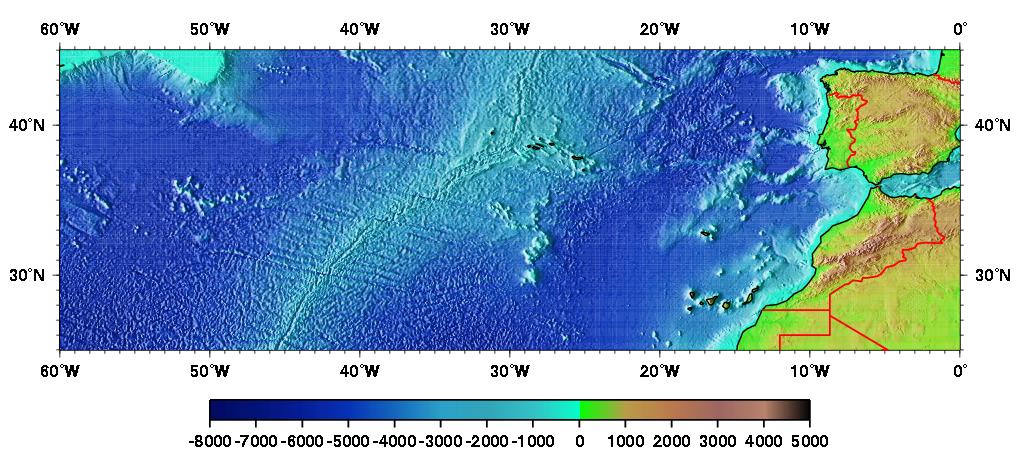
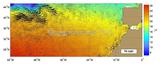
Figure 2.
Global Ocean Surface Velocities from Drifters
(top panel w/ SST, bottom panel w/ Speed)
Figure Caption is Under Construction.
Click here for example plots of
seasonal averages.
|
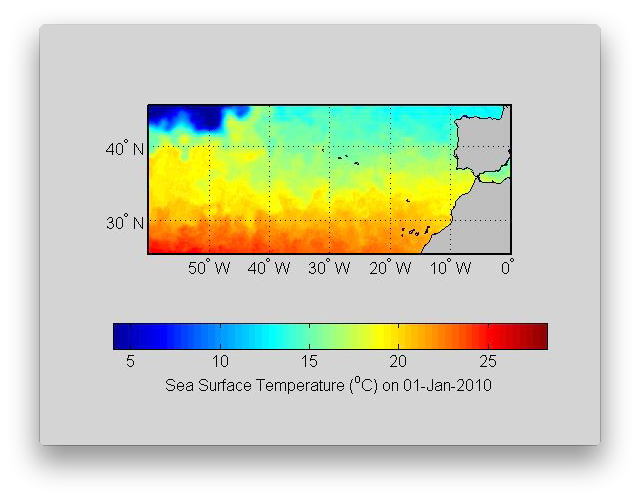 |
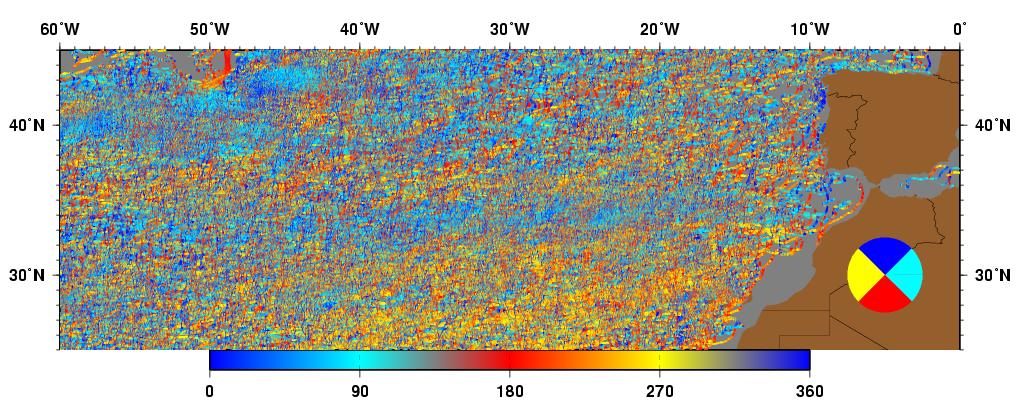
Figure 3.
The Azore Islands are south of 40°N between 35°W to 25°W. The Azore front with cooler water to the north and warmer water to the south is visible in this animation . The Azores Current is most visible when SST is warm during the summer months from mid July to mid September. There is a lot of eddy variability in this area.
( Click the thumbnail to play the animation. )
|
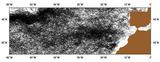 |
Figure 4.
|
 |
Figure 5.
|
 |
Figure 6.
|
 |
Figure 7.
Trajectories of three buoys (ID 23708, 23762 and 23765) whose
net movement is consistent with the subtropical flow in
the North-East Atlantic. All the buoys start in the Gulf Stream
Current, east of 60 W and travel primarily eastward/southeastward
in the Azores Current to near 35 S. All three buoy trajectories
illustrate current meanders and significant eddy motion. Two of
the buoys (ID 23765 and 23708) are advected to the southwest by
the Canary Current.
|
 |
Figure 8.
These two buoys are in the southern domain of the Azores Current.
These buoy trajectories also illustrate current meanders and eddy motion.
Buoy 09421108 ends up in the Portugal Current area, while
buoy 09421109 enters the Canary Current in the winter of 1995/96.
The trajectory of Buoy 09421109 is a good example of a buoy whose mean
path traces out a "tight" North Atlantic subtropical gyre,
yet it has significant spatial variability at a multitude of scales.
There is meandering with a wavelength of about 500 km in spring of 1995,
followed by meanders and eddies with scales on the order of 100 km.
Also, in fall of 1995 and spring of 1996,
looping motion with scales of tens of km are evident.
|
 |
Figure 9.
AVRRR image of the sea-surface temperature (SST).
|
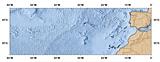 |
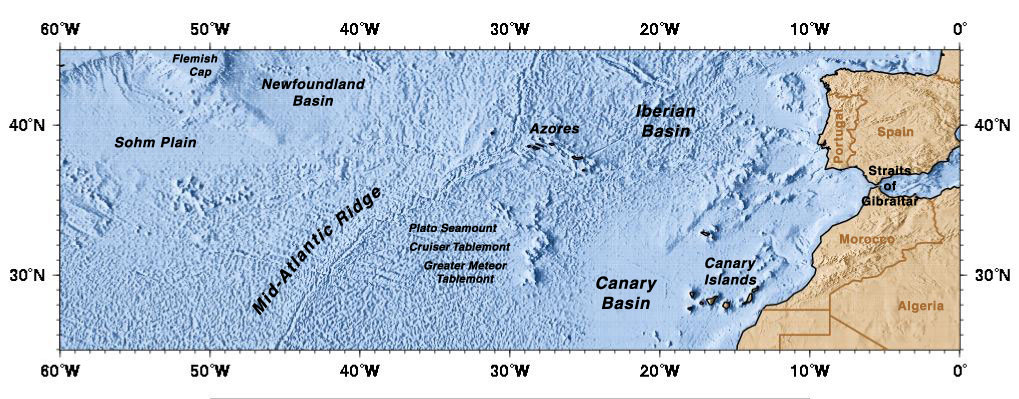
Figure 10.
Geography of the region.
|
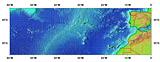 |
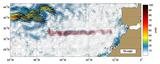
Figure 11.
Topography/Bathymetry of the region.
|