 |
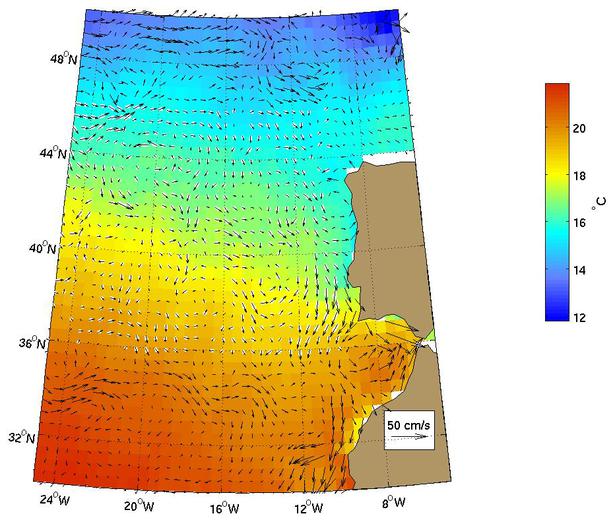
Figure 1.
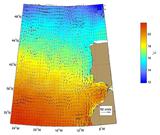
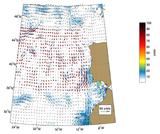
The Portugal current as represented by the Mariano Global Surface Velocity
Analysis (MGSVA). The average flow is towards the south and feeds the Canary
Current. Highlighted in red is the area where the coastal current can flow
northward, depending on the winds. Click here for example plots of
seasonal averages.
|
|
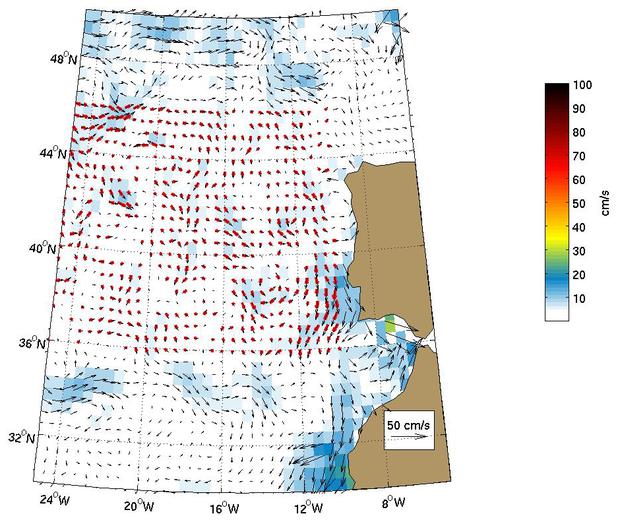
Figure 2.
Global Ocean Surface Velocities from Drifters
(top panel w/ SST, bottom panel w/ Speed)
Figure Caption is Under Construction.
Click here for example plots of
seasonal averages.
|
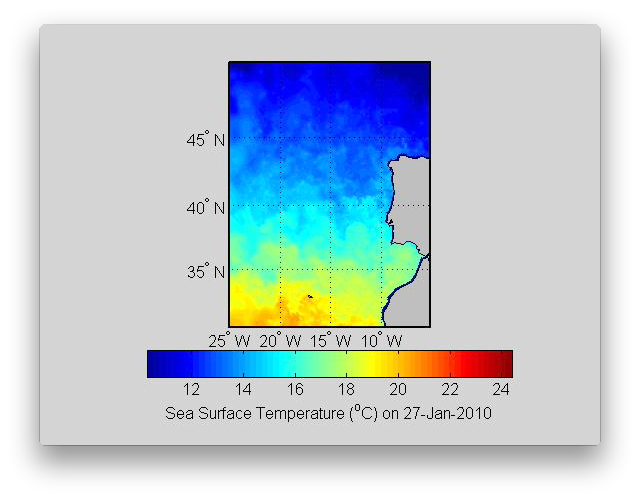 |
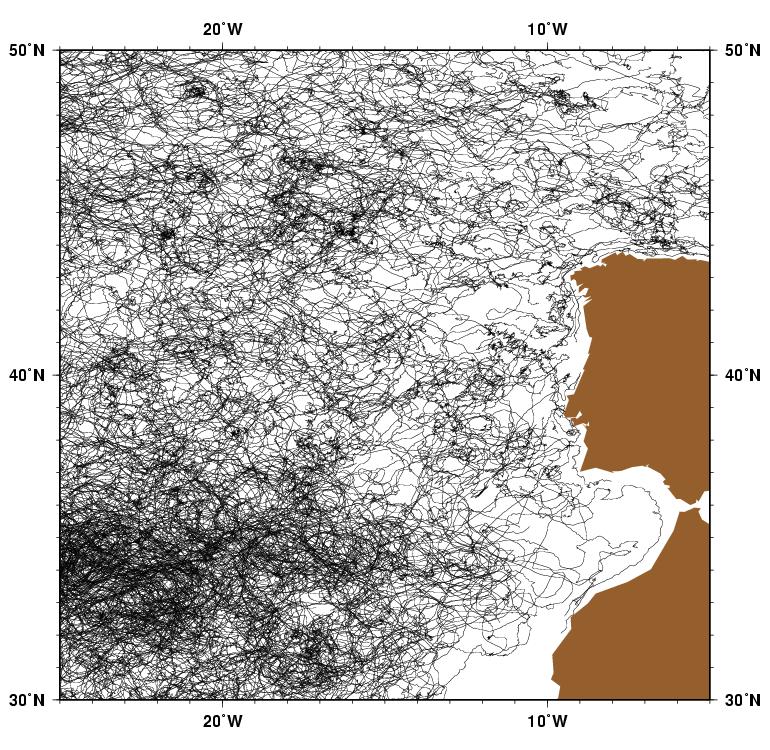
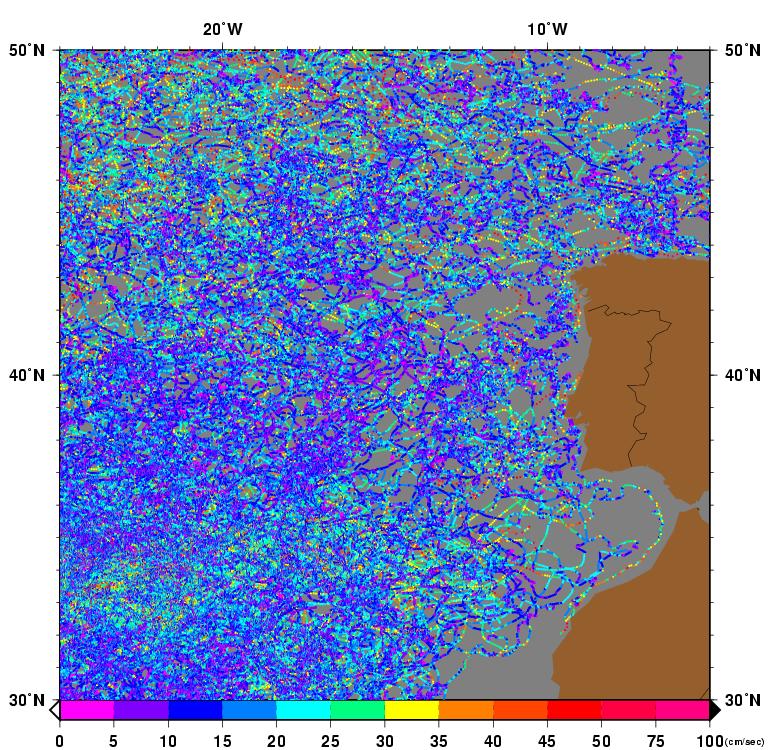
Figure 3.
The Portugal Current is most visible between 10°W and the Iberian Coast in the winter and especially in March. A cyclonic eddy, north of 40°N, transports water northward right along the coast and then feeds the southward flowing Portugal Current. Smaller eddies are visible that exchange cooler coastal waters with warmer offshore water.
( Click the thumbnail to play the animation. )
|
 |
Figure 4.
|
 |
Figure 5.
|
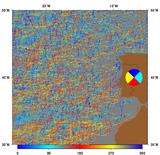 |
Figure 6.
|
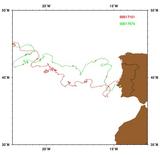 |
Figure 7.
As these buoys approach the Portuguese coast from the Northeast Atlantic,
their general southwestward motion turns northward. Both buoys indicate
northward flow in the Portugal Coastal Current.
|
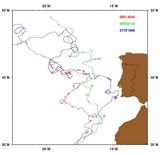 |
Figure 8.
These buoys show that the Portugal Current feeds the Azores Current and Canary
Current. The Portugal Current and Canary Current are the southward-flowing
eastern boundary currents of the North Atlantic subtropical gyre.
|
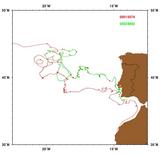 |
Figure 9.
These buoys both illustrate an overall net flow to the southwest, west, and
then along-shore. Superimpose on this net flow is significant eddy
variability both in the Northeast Atlantic and along the Iberian Peninsula.
|
 |
Figure 10.
AVRRR image of the sea-surface temperature (SST).
|
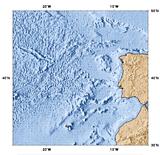 |
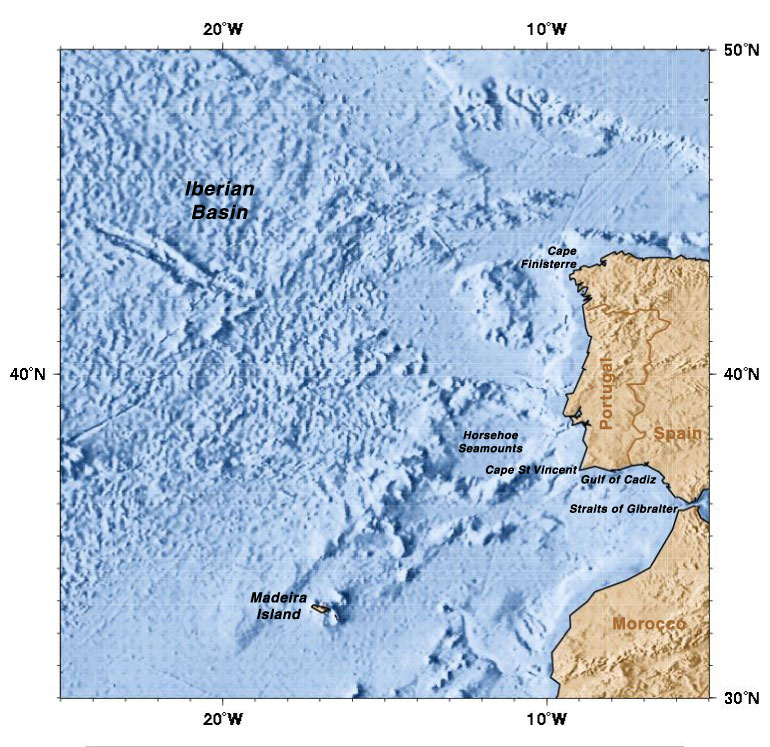
Figure 11.
Geography of the region.
|
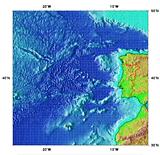 |
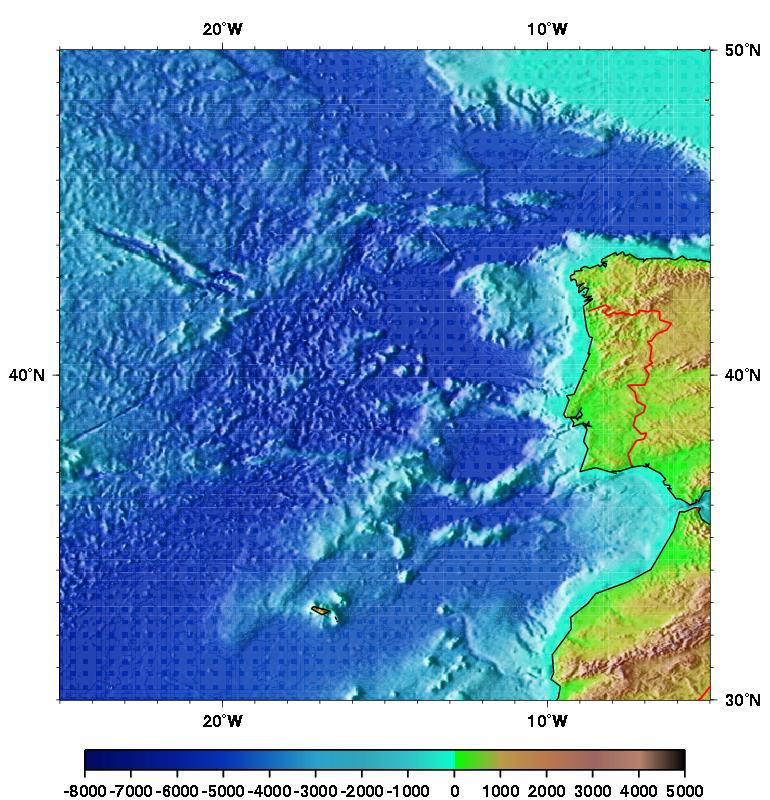
Figure 12.
Topography/Bathymetry of the region.
|