 |
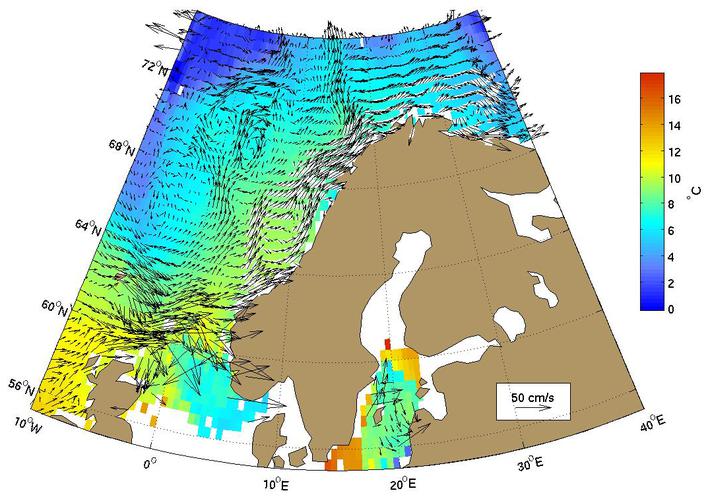
Figure 1.
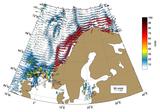
The Norwegian current as represented by the Mariano Global
Surface Velocity Analysis (MGSVA). The Norwegian current has an offshore
branch and a coastal component that hugs the coast of Norway. It
transports relatively warm, saline waters into the Arctic Ocan and
this influences the amount of winter-time convection and water mass
formation.
Click here for example plots of
seasonal averages.
|
|
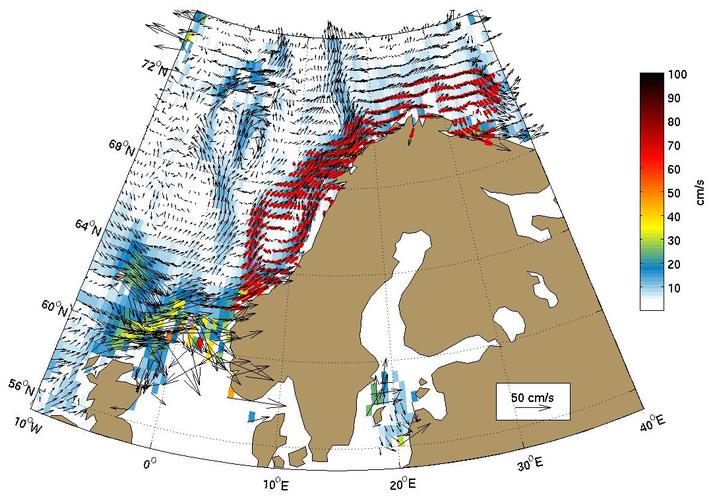
Figure 2.
Global Ocean Surface Velocities from Drifters
(top panel w/ SST, bottom panel w/ Speed)
Figure Caption is Under Construction.
Click here for example plots of
seasonal averages.
|
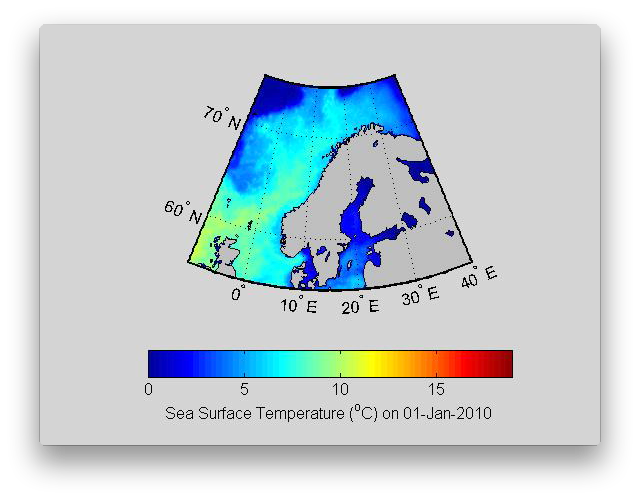 |
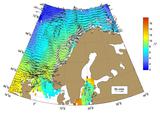
Figure 3.
The Norwegian Current transports relatively warm water along the
Norwegian coast into the Norwegian and Barents Seas. The energetic
eddy field associated with the Norwegian Current entrains coastal waters
into the ocean interior, a process visible throughout the year. in the summer months, the
coastal water is warmer, while in the winter the coastal waters are cooler.
The animation clearly shows the Shetland/Shelf Current feeding the Norwegian Current.
( Click the thumbnail to play the animation. )
|
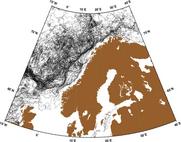 |
Figure 4.
|
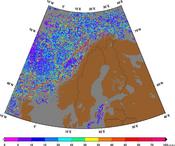 |
Figure 5.
|
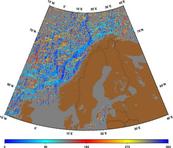 |
Figure 6.
|
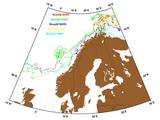 |
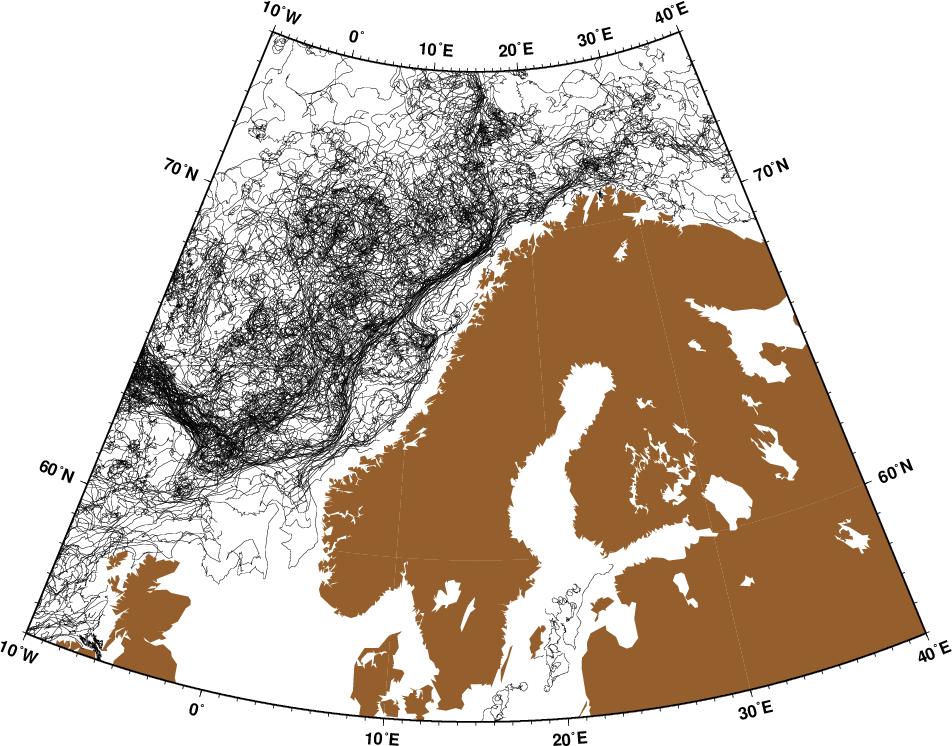
Figure 7.
Buoys ID 00467 (red), 02004 (green), 08335 (blue), 14383 (yellow), and
15896 (cyan) are a few of the examples of buoy trajectories in the Norwegian
Current and its small-scale eddy field. Buoy 00467 is in the offshore
branch of the Norwegian Current in December of 1994 and moves closer
to shore over the winter. Buoy 02004 is in the Slope Current during
March of 1993 and in the core of the Norwegian Current in November of
1993. Buoy 08335 is close to shore in April and May of 1992 and, like
most other buoys, ends up in the North Cape Current. Buoy 14383 is in
the Norwegian Current during February of 1992 and also ends up in the
North Cape Current five months later. Buoy 15986 is another example of
buoys in the eastward-flowing East Iceland Current that do not go north but
continue to the east and end up hugging the coast of Norway and Russia.
|
 |
Figure 8.
AVRRR image of the sea-surface temperature (SST).
|
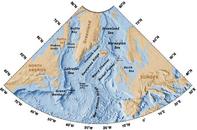 |
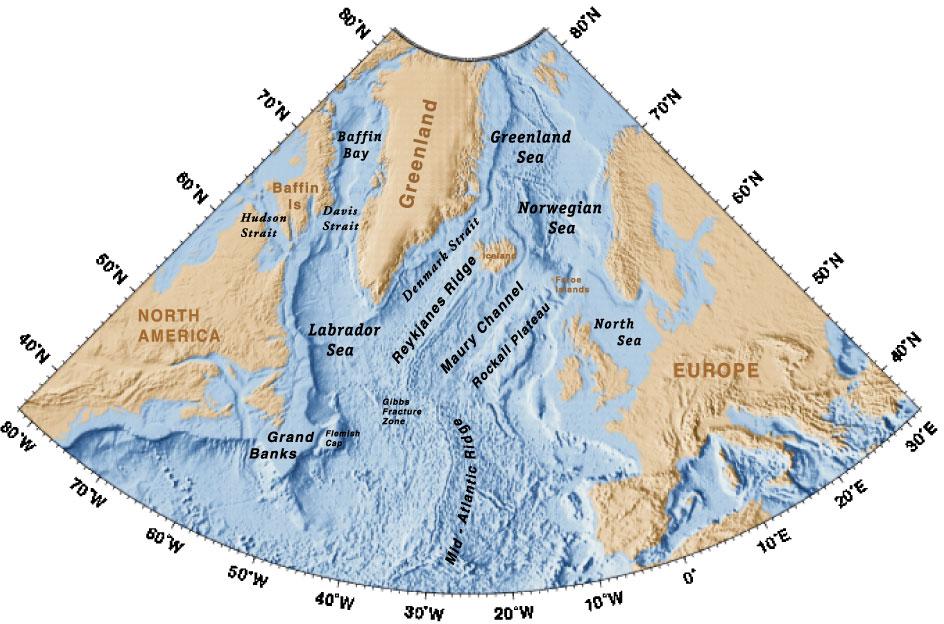
Figure 9.
Geography of the region.
|
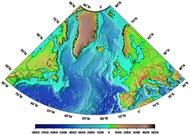 |
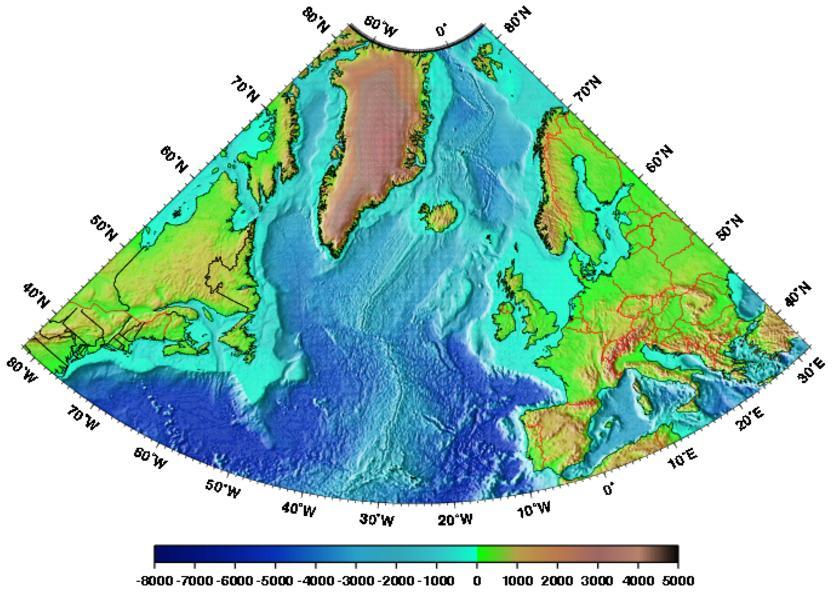
Figure 10.
Topography/Bathymetry of the region.
|