|
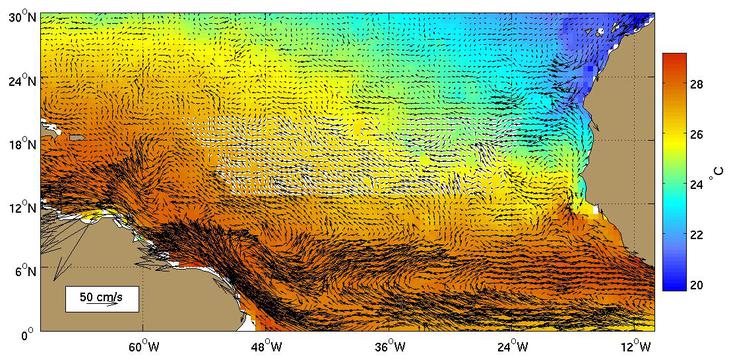
Figure 1.
The North Equatorial Current (NEC) as represented by the Mariano
Global Surface Velocity Analysis (MGSVA). The NEC is the broad westward
flow that is the southern component of the N. Atlantic subtropical gyre.
It is fed by the Canary Current and its waters eventually end up in
the Gulf Stream system, either via the Antilles current or through the
Caribbean via the Guiana current.
Click here for example plots of
seasonal averages.
|
|
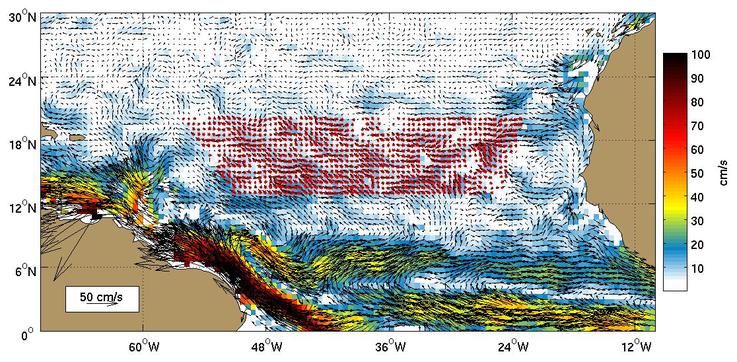
Figure 2.
Global Ocean Surface Velocities from Drifters
(top panel w/ SST, bottom panel w/ Speed)
Figure Caption is Under Construction.
Click here for example plots of
seasonal averages.
|
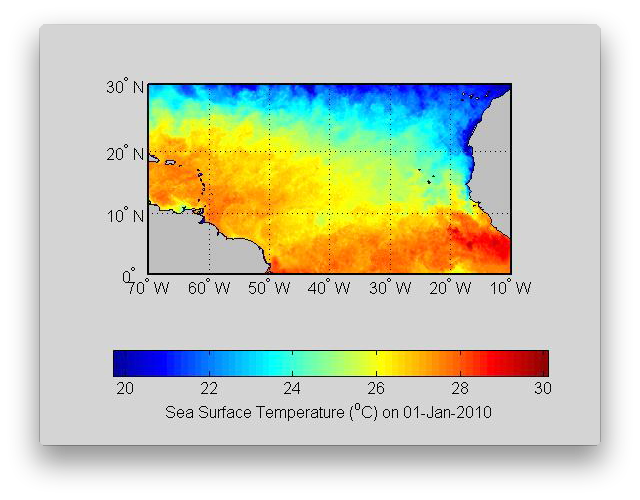 |
Figure 3.
There is a strong seasonal signal in the North Equatorial Current (NEC).
The NEC is weak at the end of the end of winter and early spring. The NEC
increases its flow during summer and fall. The westward transport of relatively cool water by the NEC from the eastern tropical Atlantic, offshore of Africa, leads to lower SST values in the ocean interior that what is observed at comparable latitudes in the western tropical Atlantic.
( Click the thumbnail to play the animation. )
|
 |
Figure 4.
|
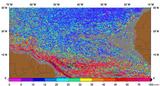 |
Figure 5.
|
 |
Figure 6.
|
 |
Figure 7.
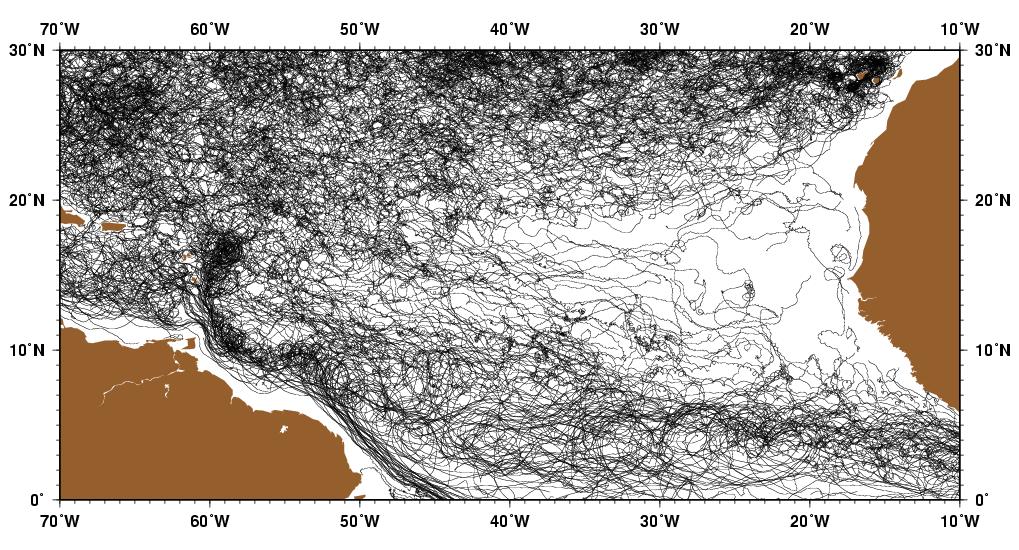
The path of these buoys all illustrate the retroflection of the North Brazil
Current, that feeds the North Equatorial Counter-Current (NECC) and
subsequently, the North Equatorial Current (NEC). Buoy 0019118 travels
thousands of km eastward in the NECC before being entrained into the
westward flowing NEC near 21°W.
|
 |
Figure 8.
In contrast to the buoys in figure 2, both these buoys were in the
Canary Current before entering the westward flowing North Equatorial
Current (NEC). More or less, these buoys stay near the northern
boundary of the NEC before entering the Antilles Current.
|
 |
Figure 9.
AVRRR image of the sea-surface temperature (SST).
|
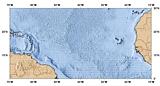 |
Figure 10.
Geography of the region.
|
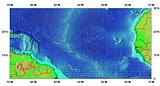 |
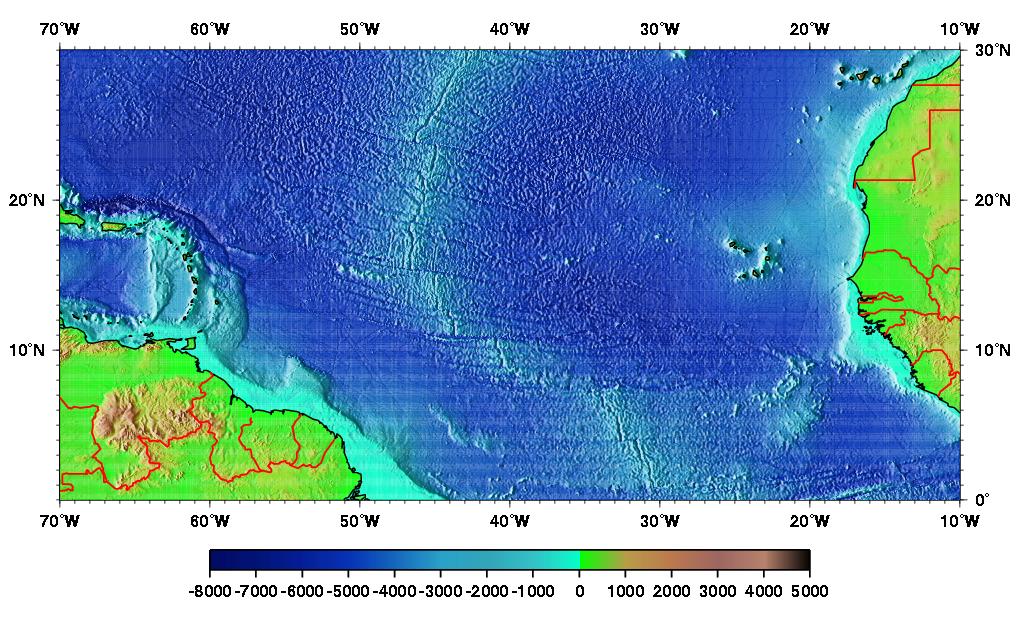
Figure 11.
Topography/Bathymetry of the region.
|