 |
Figure 1.
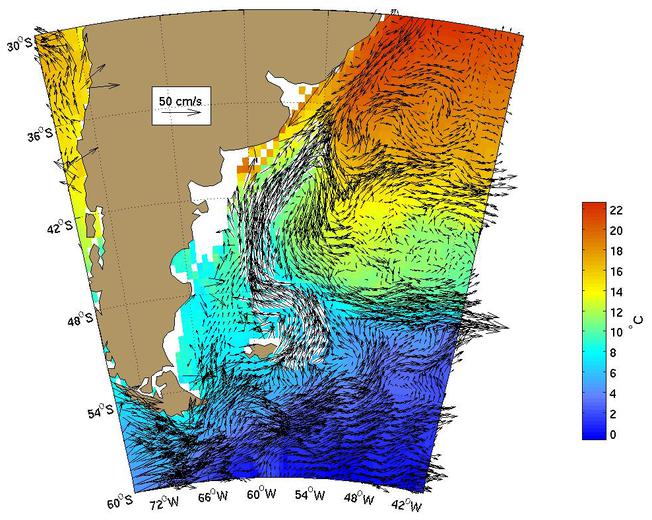
The Malvinas current as represented by the Mariano Global Surface
Velocity Analysis (MGSVA). It is the northward flow component of
the S. Atlantic subpolar gyre. The Malvinas current transports cold
water along the coast of S. America and this water mixes with warmer
waters of the Brazil current in an region known as the Brazil-Malvinas
confluence.
Click here for example plots of
seasonal averages.
|
|
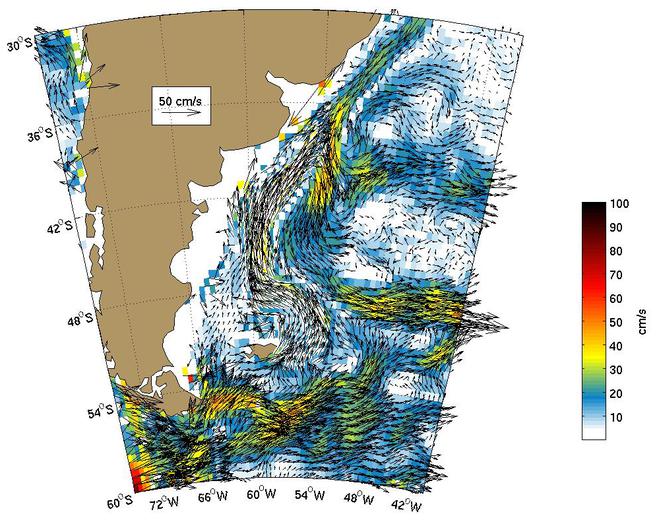
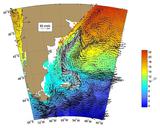
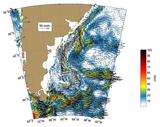
Figure 2.
Global Ocean Surface Velocities from Drifters
(top panel w/ SST, bottom panel w/ Speed)
Figure Caption is Under Construction.
Click here for example plots of
seasonal averages.
|
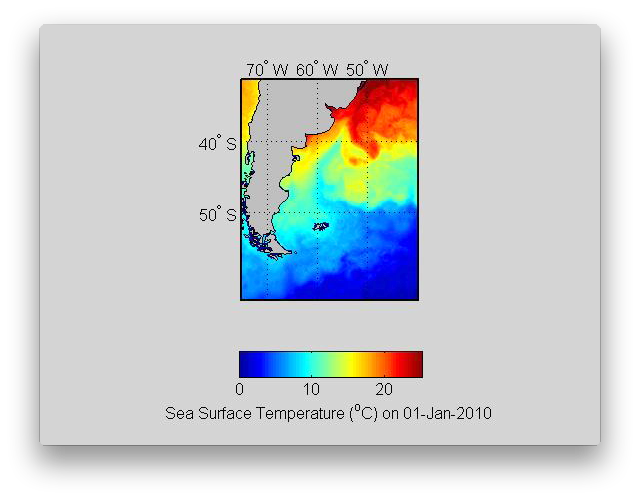 |
Figure 3.
The Malvinas Current transports cold water northward from the subpolar South
Atlantic into the subtropical South Atlantic. It is visible throughout most of the
year, especially from May through October. The cooler Malvinas Current meets
the warmer waters of the Brazil Current in the region known as the Brazil-Malvinas confluence. There is a strong gradient in SST in the confluence.
( Click the thumbnail to play the animation. )
|
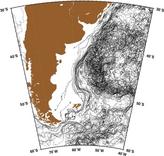 |
Figure 4.
|
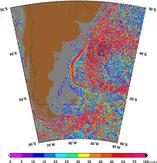 |
Figure 5.
|
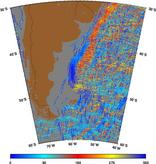 |
Figure 6.
|
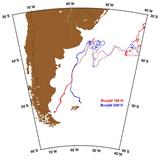 |
Figure 7.
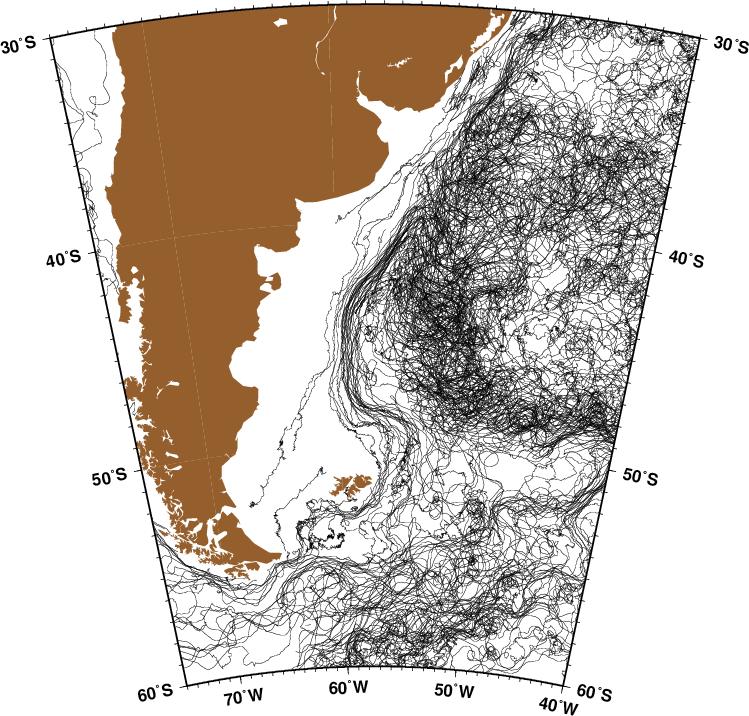
Buoy ID 16618 (red) is in the inshore branch of the Malvinas Current,
while buoy 25815 (blue) is in the offshore branch of the Malvinas
Current, poleward of 48°S. Buoy 16618 is in the strongest part of
the Malvinas Current in September and October of 1997 before changing
course in the Brazil-Malvinas Confluence region. During November 1997,
buoy 16618 is the eastward moving Brazil Current. Buoy 25815 is in
the Malvinas Current during the winter of 1997-98 before having a
similar fate as buoy 16618. Both these trajectories illustrate that
the Malvinas current transports significant amounts of cold surface
waters into temperate climates where it mixes with the warmer waters
of the Brazil Current.
|
 |
Figure 8.
AVRRR image of the sea-surface temperature (SST).
|
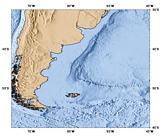 |
Figure 9.
Geography of the region.
|
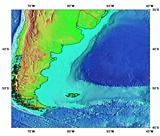 |
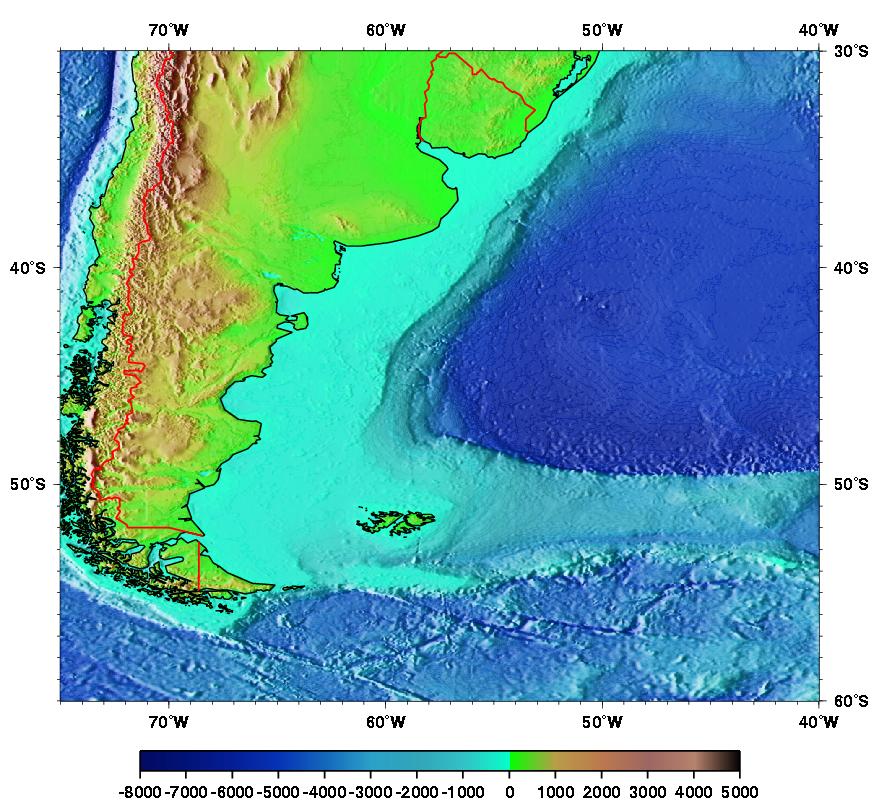
Figure 10.
Topography/Bathymetry of the region.
|