 |
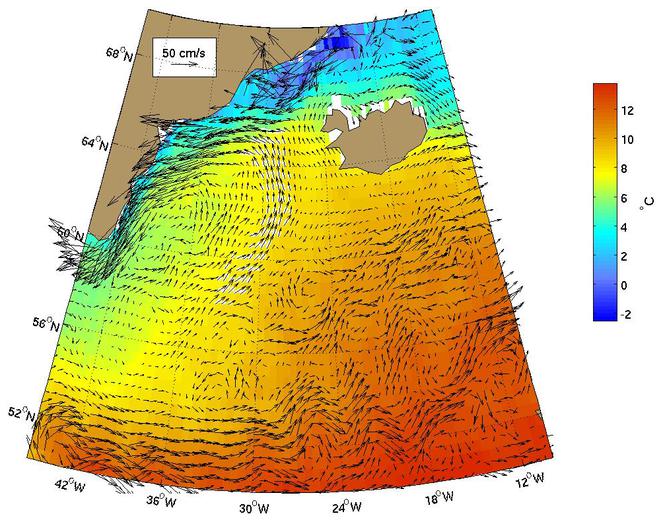
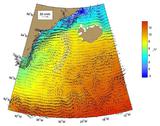
Figure 1.
The Irminger current as represented by the Mariano Global Surface
Velocity Analysis (MGSVA). The Irminger current is the northward flowing
component of the N. Atlantic subpolar gyre. It transports relatively
warm water that mixes with colder water transported by the E. Greeland
current from the Arctic Ocean.
Click here for example plots of
seasonal averages.
|
|
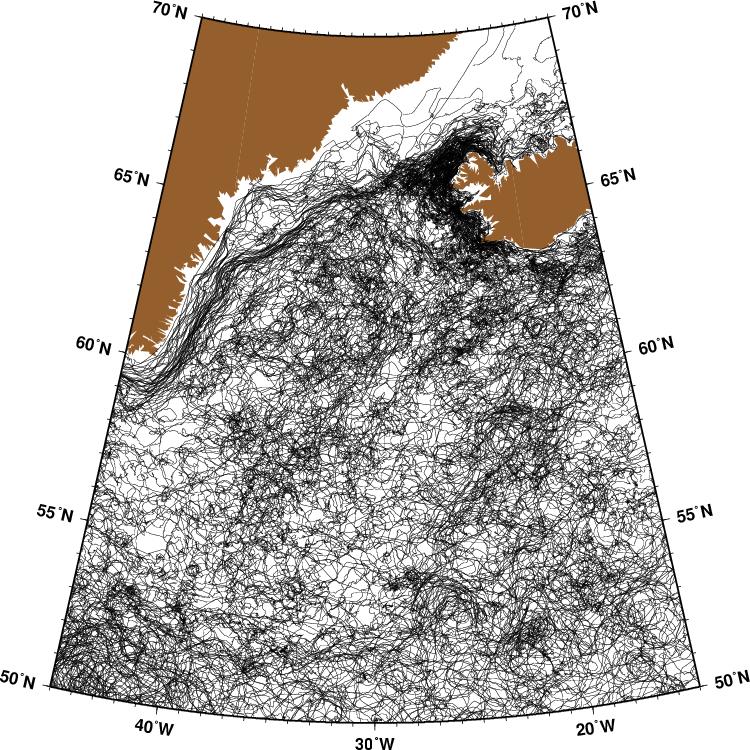
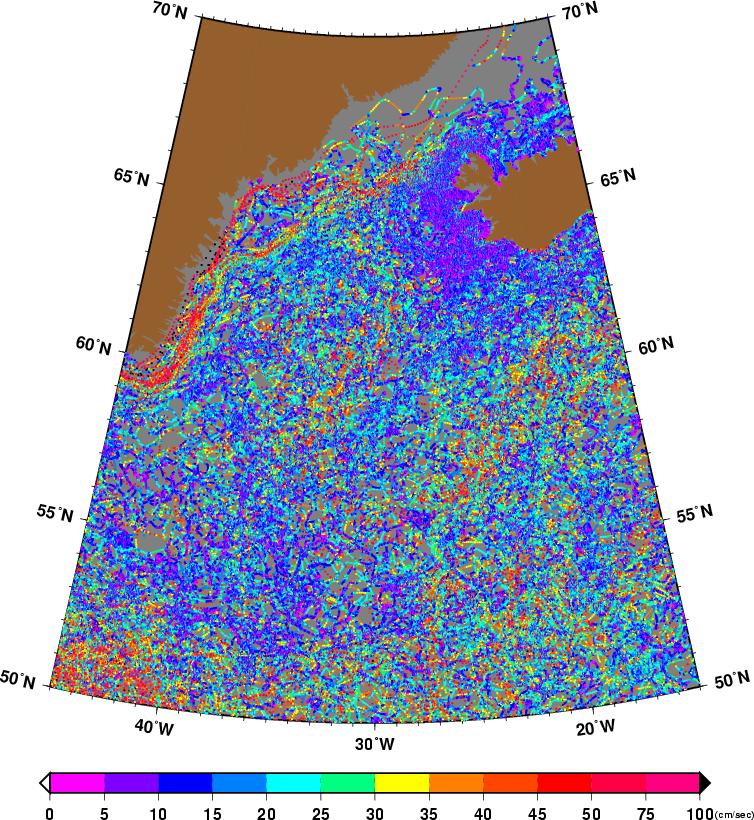
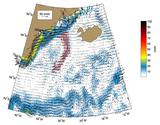
Figure 2.
Global Ocean Surface Velocities from Drifters
(top panel w/ SST, bottom panel w/ Speed)
Figure Caption is Under Construction.
Click here for example plots of
seasonal averages.
|
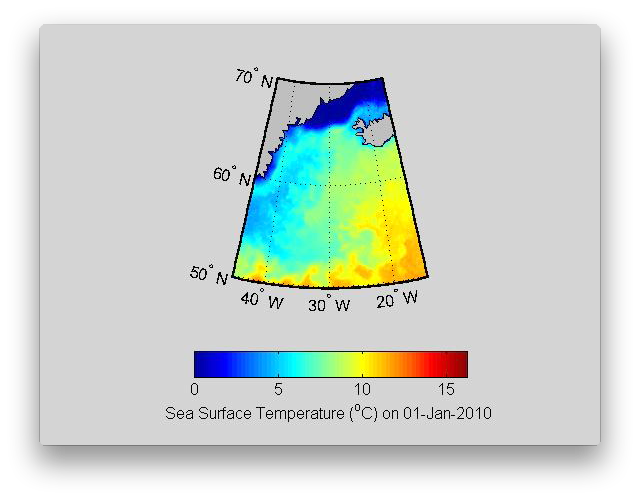 |
Figure 3.
The Irminger Current is found at the boundary between the cooler waters west of 30°W and warmer waters east of 30°W. The Irminger Current transports relatively warmer waters northward along this boundary.
( Click the thumbnail to play the animation. )
|
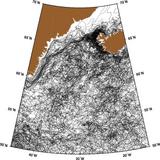 |
Figure 4.
|
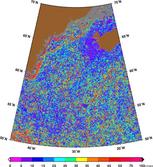 |
Figure 5.
|
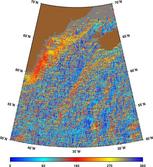 |
Figure 6.
|
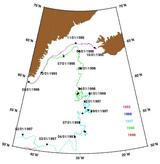 |
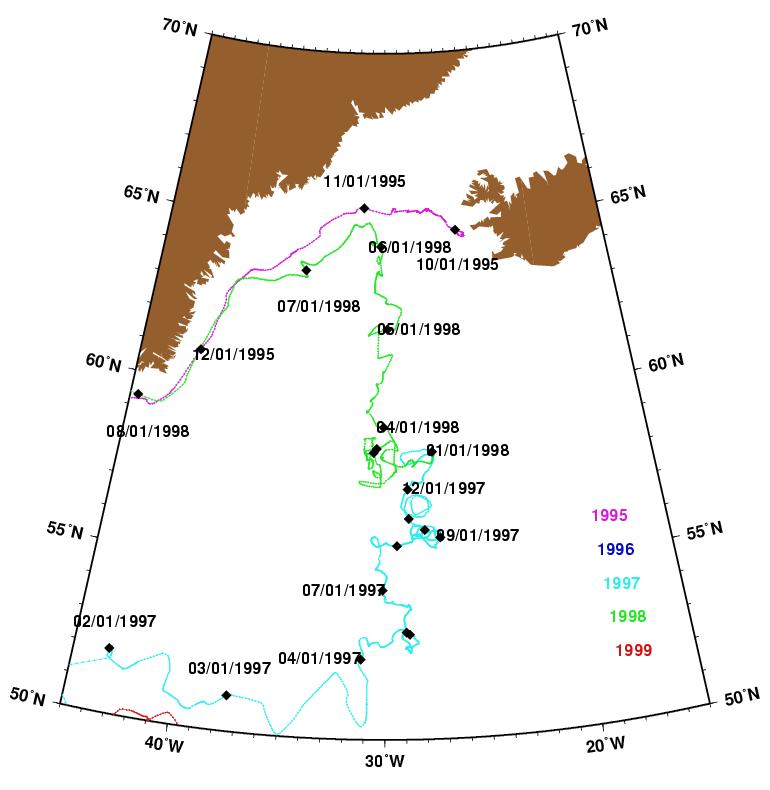
Figure 7.
This buoy (ID 25308) is launched west of Iceland in the fall
of 1995 in the Irminger Current. It is in the East Greenland
Current during November-December of 1995. In the spring of 1997,
the float is in the Irminger Current, after it completed
a loop around the North Atlantic subpolar gyre. In July of 1998,
it is back in the Greenland Current (Also see text of
Labrador Current Figure 7.).
|
 |
Figure 8.
AVRRR image of the sea-surface temperature (SST).
|
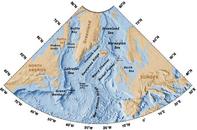 |
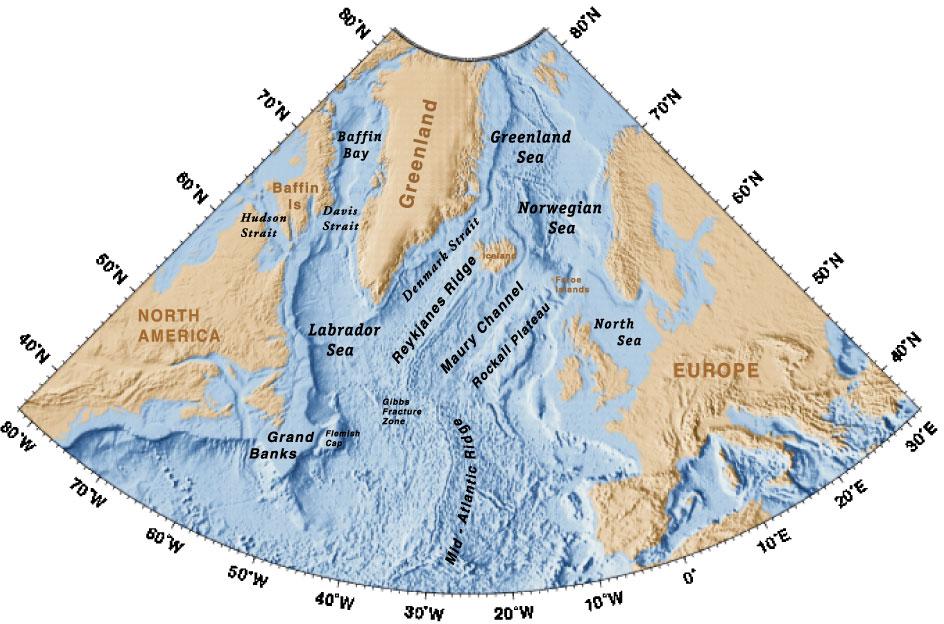
Figure 9.
Geography of the region.
|
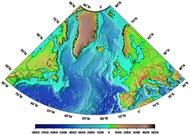 |
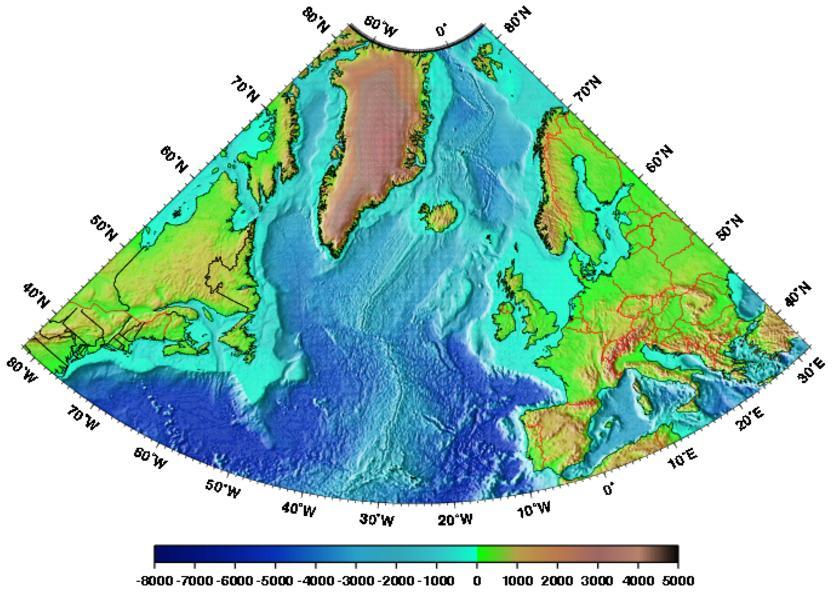
Figure 10.
Topography/Bathymetry of the region.
|