|
Figure 1.
The Florida current is a well-defined component of
the Gulf Stream system. On the average, the inner
edge is within 10 miles of Miami and Ft. Lauderdale,
FL, and at times there is a 2 m/s flow within a few
miles of the coast. Note that part of the flow
recirculates in an elongated counter-clockwise
flowing cell in the South Atlantic Bight.
Click here for example plots of
seasonal averages.
|
|
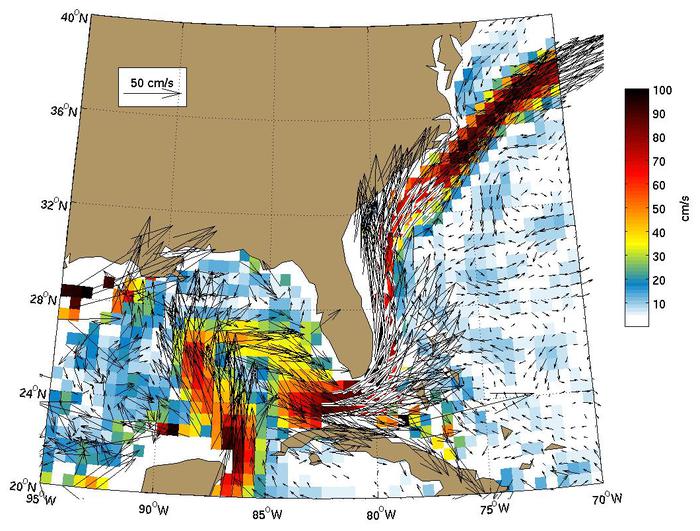
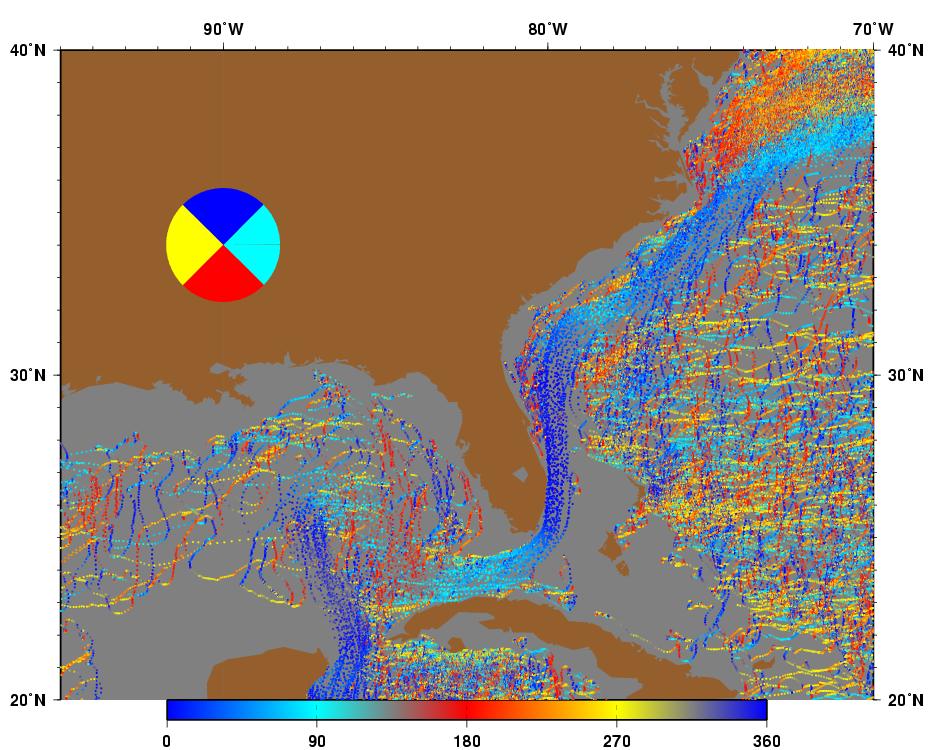
Figure 2.
Global Ocean Surface Velocities from Drifters
(top panel w/ SST, bottom panel w/ Speed)
Figure Caption is Under Construction.
Click here for example plots of
seasonal averages.
|
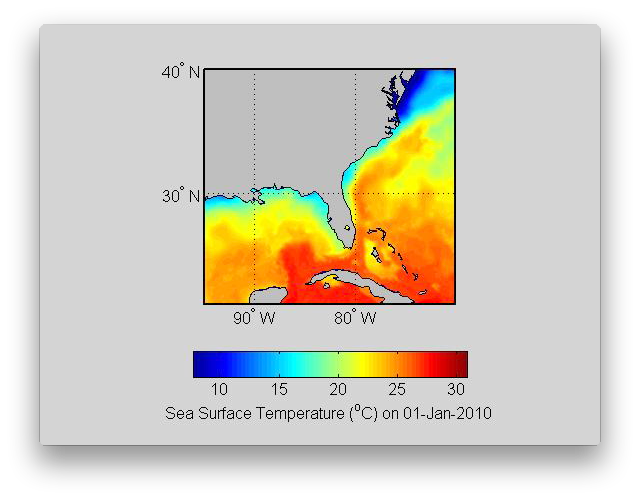 |
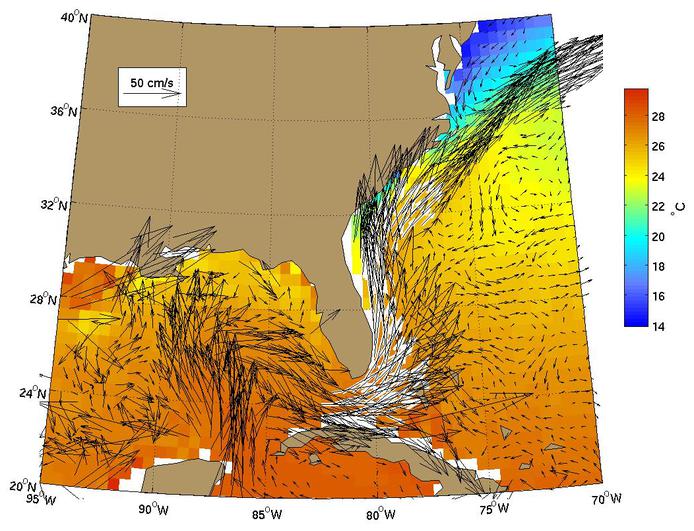
Figure 3.
The Florida Current transports warmer water northward from the Florida Straits
into the Gulf Stream. The Florida Current is the ribbon of warmest waters near 80°W. The meandering of the Florida Current is constrained by topography
between South Florida and the Bahama Bank.
As the Florida Current approaches 30°N and offshore of the Carolinas it has more freedom to meander.
There are numerous eddy stream interactions evident along the eastern boundary where
warm water is wrapped around the counter-clockwise flowing eddies.
( Click the thumbnail to play the animation. )
|
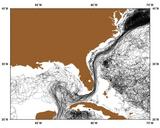 |
Figure 4.
|
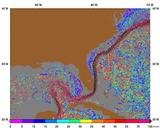 |
Figure 5.
|
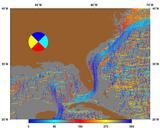 |
Figure 6.
|
 |
Figure 7.
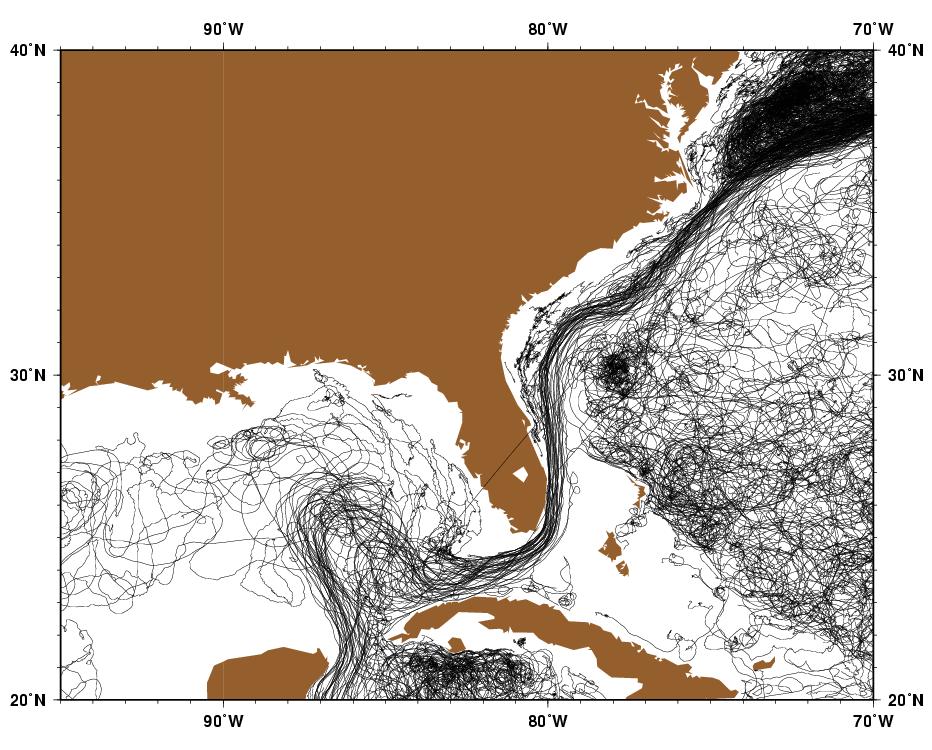
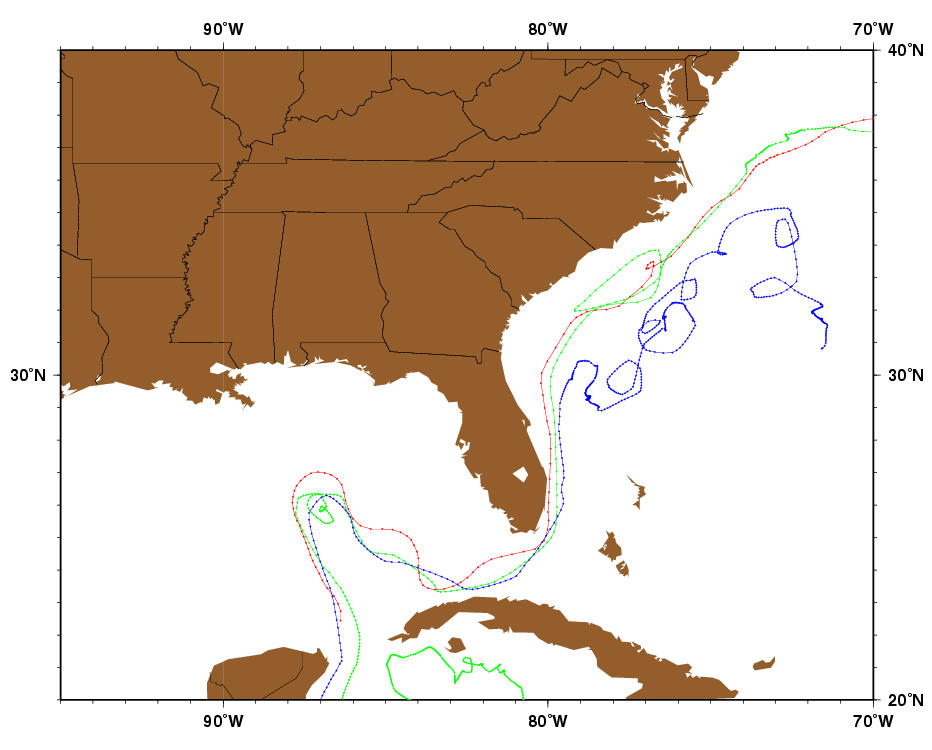
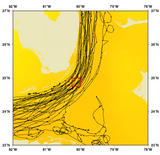
The trajectories of three near-surface drifters that illustrate
(1) that source waters for the Florida current are from the Caribbean Sea
and Gulf of Mexico via the Loop current;
(2) The Florida current feeds the Gulf Stream that flows east of Cape Hatteras;
(3) the looping motion in Buoy ID 30688 (blue) is due to the buoy being
in a Gulf stream spin-off eddy
(Spin-off eddies are also found inshore of the Gulf Stream); and
(4) the looping motion in Buoy ID 30659 (green), off of the Carolina Coast,
is due to the buoy being in South Atlantic Bight recirculation cell that
is also evident in Figure 1.
|

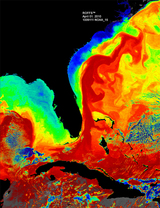 |
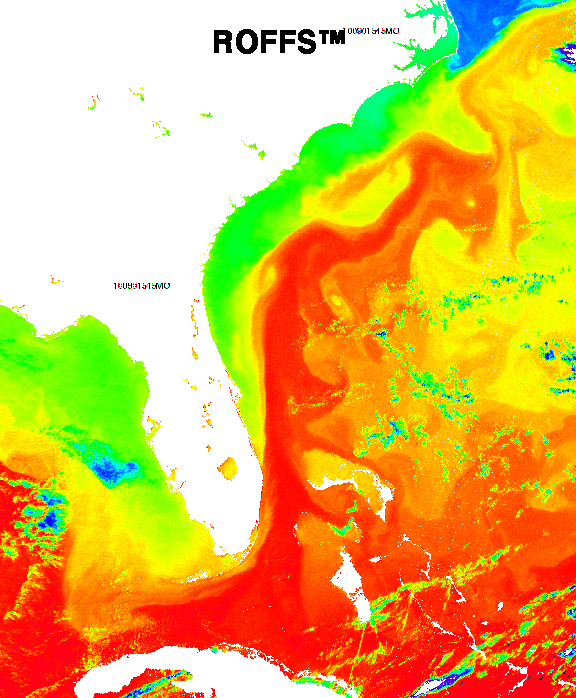
Figure 8.
Two beautiful sea surface temperature images of the Florida Current.
Hotter colors are warmer waters in the image, the core of the Florida
Current has very warm water, and the speckled coolest colors are clouds.
There are many different size features in these images.
Numerous eddies are evident on both sides of the Florida Current by warm water
being wrapped around cold cores of waters.
Smaller eddies are also evident along the western Florida Shelf.
The eastern edge of the Loop Current is also seen in both images.
These images are courtesy of Dr. Mitch Roffer
(ROFFS).
|
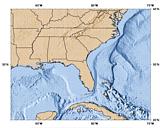 |
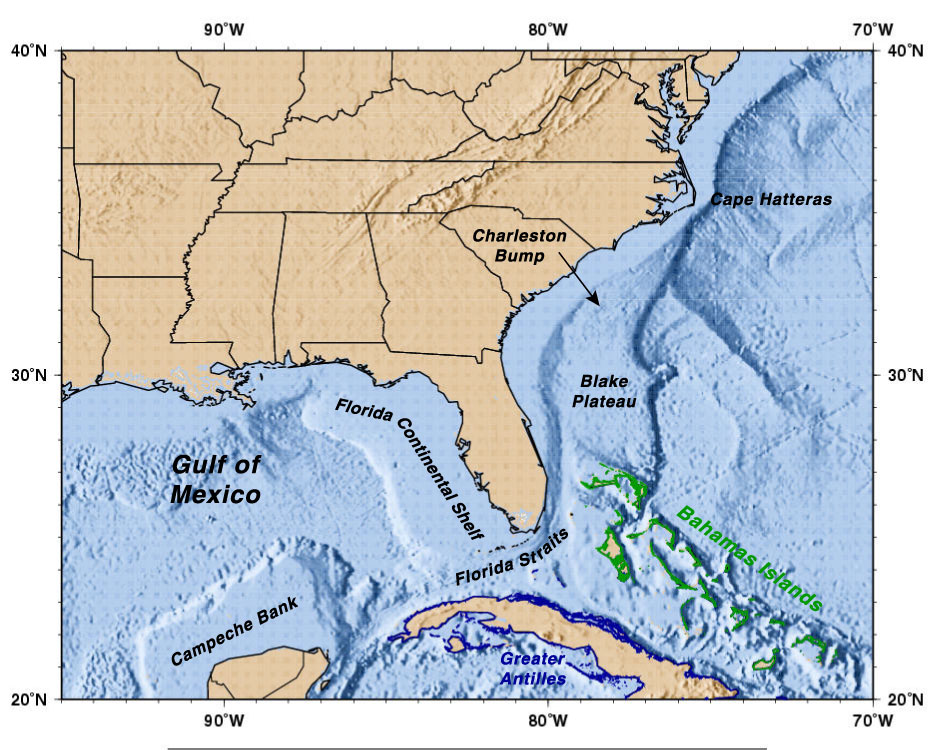
Figure 9.
Geography of the region.
|
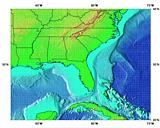 |
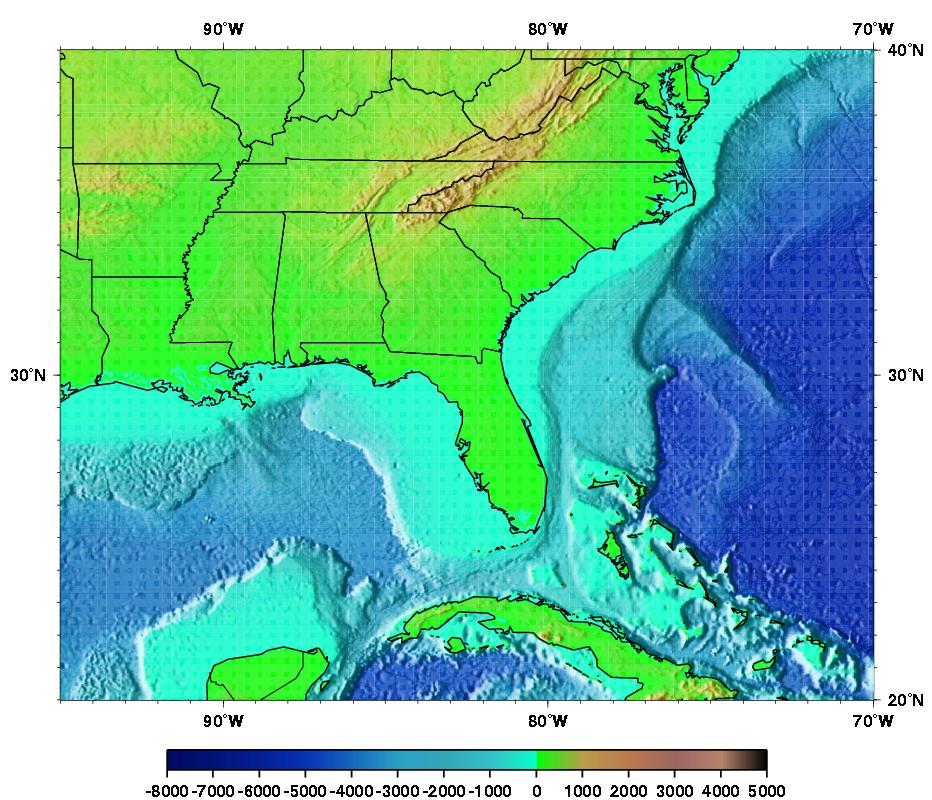
Figure 10.
Topography/Bathymetry of the region.
|
 |
Figure 11.
Some example plots of the Florida current from OSCR data taken during
the 4-D Current Experiment showing both along shore flow and eddies
trapped between the coast and the Florida current.
|
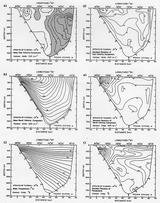 |
Figure 12.
Vertical cross-sections of the average properties of the Florida Current at
27° N observed during April 1982-July 1984, as part of the SubTropical
Atlantic Climate Studies (STACS) program. These are averages of measurements
made by the PEGASUS acoustic current profiler during 16 research cruises
(kindly provided by Kevin D. Leaman). All cross-sections are plotted as a
function of depth from the surface to 800 m and as distance, in km, from
80°W, which is approximately the shelf break off of Florida. The eastern
boundary is Little Bahama Bank.
(a) The average zonal velocity component, in cm/s, shows a relatively
strong westward flow near the Bahamas, presumably due to topographic steering.
(b) The average meridional velocity component, in cm/s, is dominated by the
northward flowing Florida Current. The peak average velocity is approximately
180 cm/s. The largest measured velocity is greater than 220 cm/s (not shown).
(c) The average temperature, in °C, of the Florida Current.
(d) The standard deviation, in cm/s, of the zonal velocity component.
(e) The standard deviation, in cm/s, of the meridional velocity component.
(f) The standard deviation of the temperature.
The largest component of the variability in the Florida Current, as seen
in the standard deviation plots, is due to the meandering of the Florida
current. The meandering time scales are as fast as days. Velocity and
temperature variability is also due to seasonal differences (i.e., the
annual signal), year-to-year differences (interannual variability), and tides.
This figure is based on figure 2 of Leaman et al. (1987). (292 kB).
|
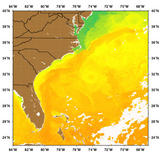 |
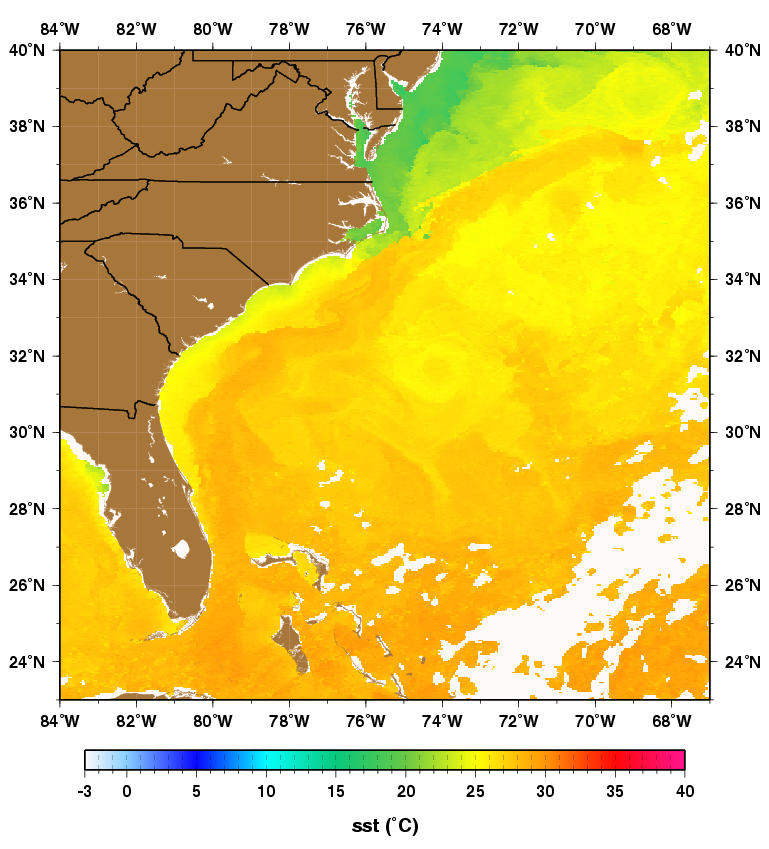
Figure 13.
A satellite-derived sea surface temperature map illustrating the relatively
warm Florida Current that hugs the southeast U.S. and flows offshore, as the
Gulf Stream, at Cape Hatteras, NC (35-36°N). Also note the deflection of
the Florida Current at the Charleston Bump (33°N), the small-scale
eddies inshore of the current at 30°N and 32.5°N, and the larger eddy
centered at 74°W, 31.5°N.
|
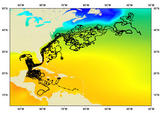 |
Figure 14.
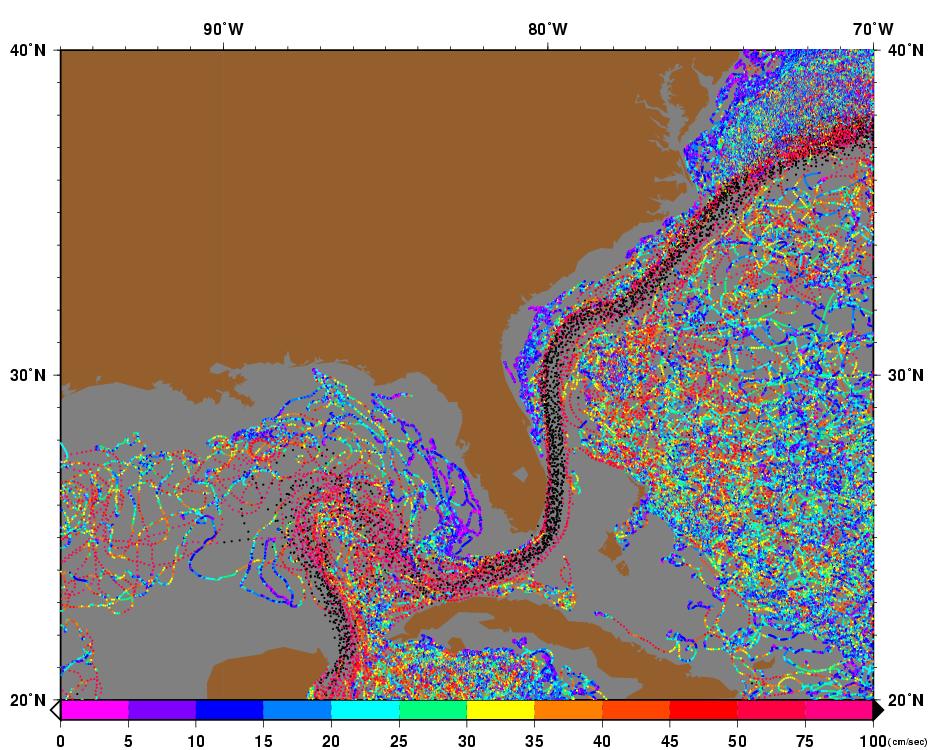
(a) The trajectories of near-surface drifters in the Florida Current
offshore of the Florida Keys. Note the outlined box. (b) All the
trajectories that went through the small box shown in a. It is evident
in this Lagrangian viewpoint that the surface waters from the Gulf
of Mexico and Caribbean Sea flow past Florida and are transported
all over the Northwest Atlantic.
|