 |
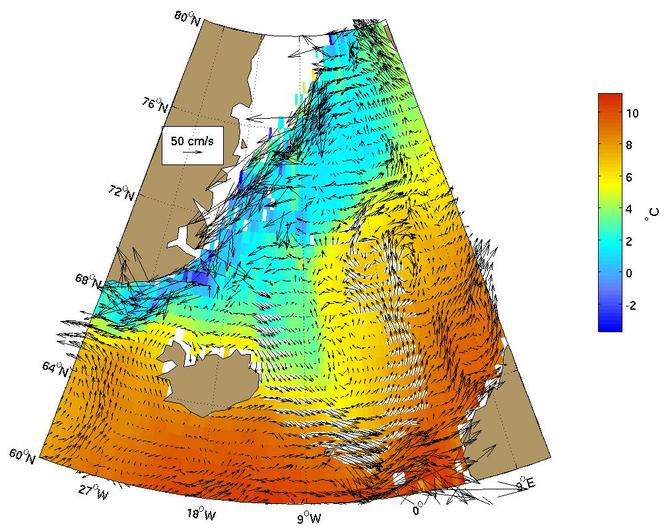
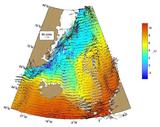
Figure 1.
The East Iceland Current as represented by the Mariano
Global Surface Velocity Analysis (MGSVA). The East Iceland Current
brings cold water south from the Norwegian Sea towards Iceland and
then eastward, along the Arctic Circle. The flow bifurcates, with
one branch going north and one branch going east.
Click here for example plots of
seasonal averages.
|
|
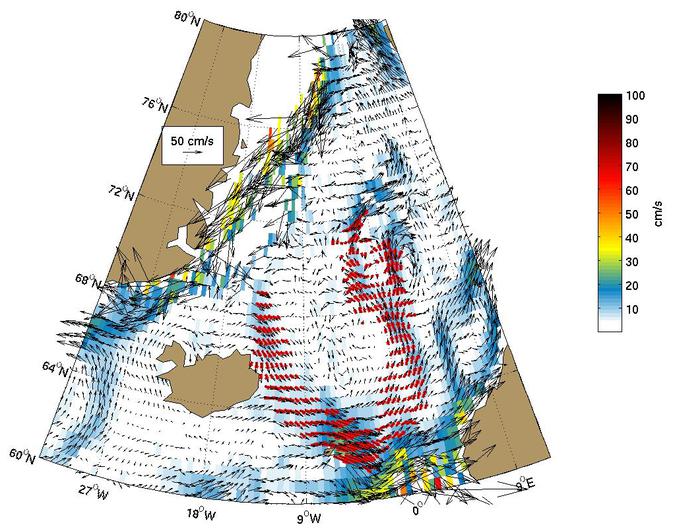
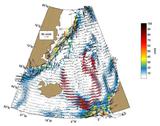
Figure 2.
Global Ocean Surface Velocities from Drifters
(top panel w/ SST, bottom panel w/ Speed)
Figure Caption is Under Construction.
Click here for example plots of
seasonal averages.
|
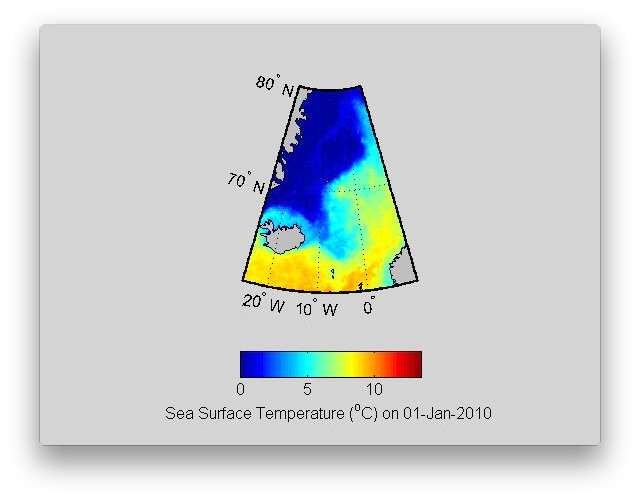 |
Figure 3.
The East Iceland Current transports and mixes cold polar southward, then eastward and finally northward of Iceland. This transport is most easily observed
during the winter months. The northward flowing branch of the East Iceland Current also advects warmer subpolar water northward and this is most evident starting in May and throughout the summer.
( Click the thumbnail to play the animation. )
|
 |
Figure 4.
|
 |
Figure 5.
|
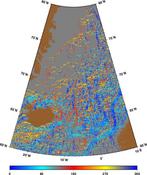 |
Figure 6.
|
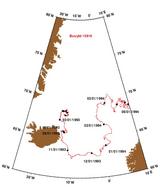 |
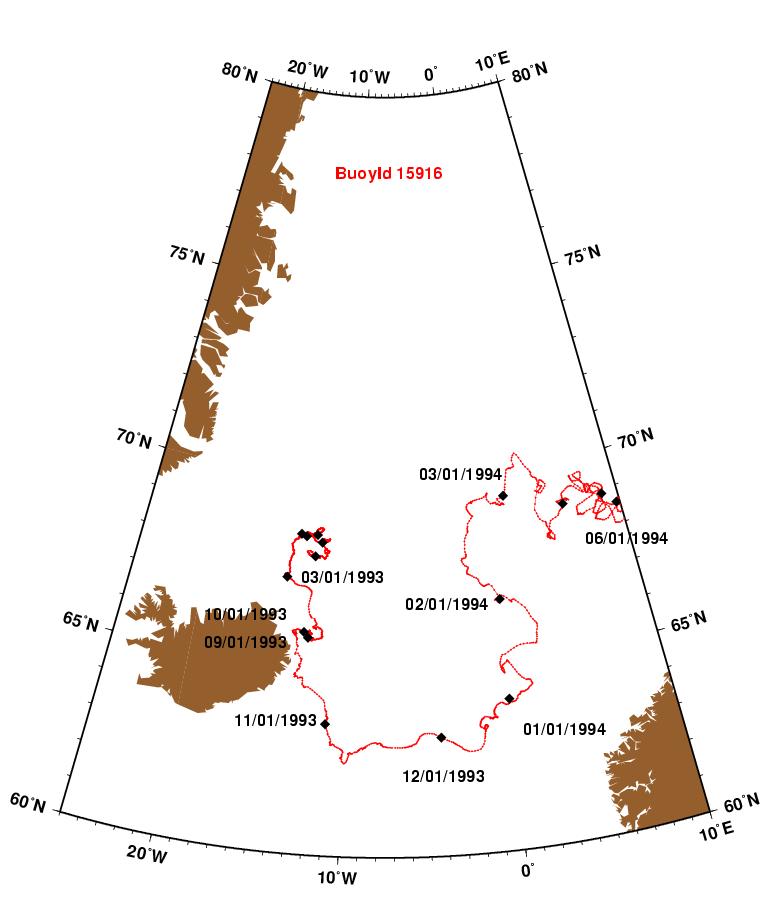
Figure 7.
This buoy (ID 15916) moved little from March 1993 to October 1993 while in
the East Iceland Current. During the next four months, it moved in a faster,
large-scale, counter-clockwise circulation before traveling eastward in
the spring of 1994.
|
 |
Figure 8.
AVRRR image of the sea-surface temperature (SST).
|
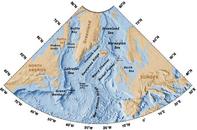 |
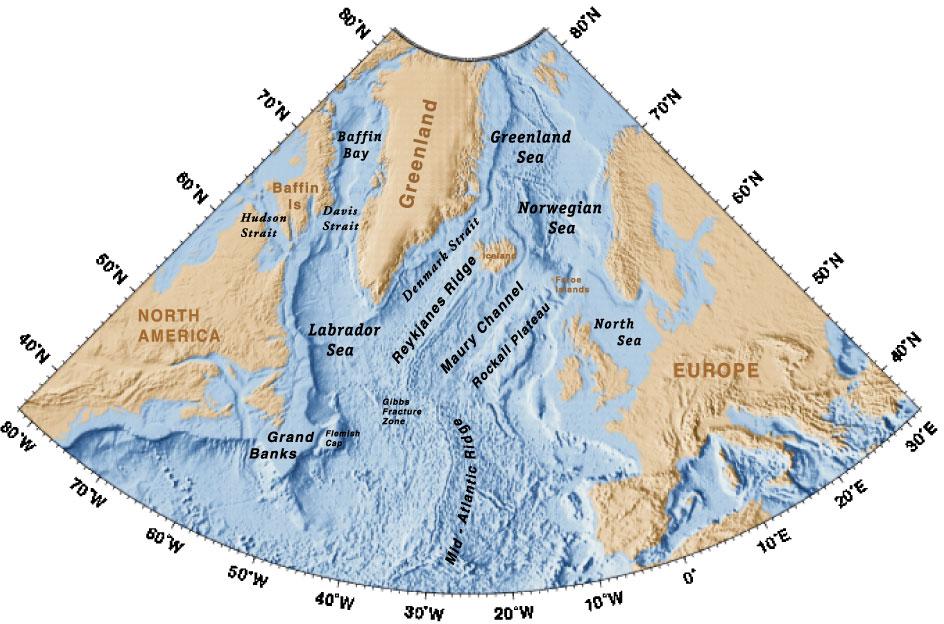
Figure 9.
Geography of the region.
|
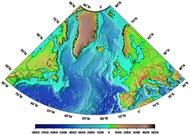 |
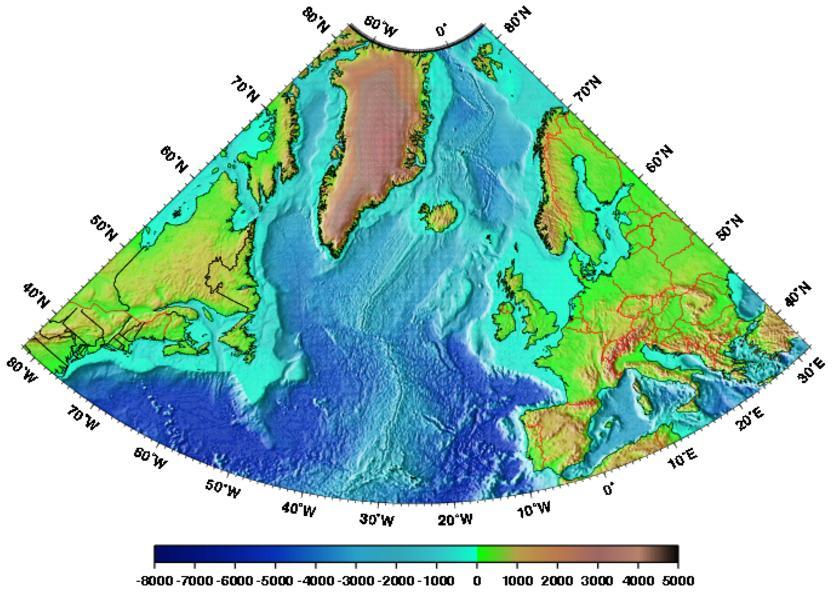
Figure 10.
Topography/Bathymetry of the region.
|