|
SST Animations
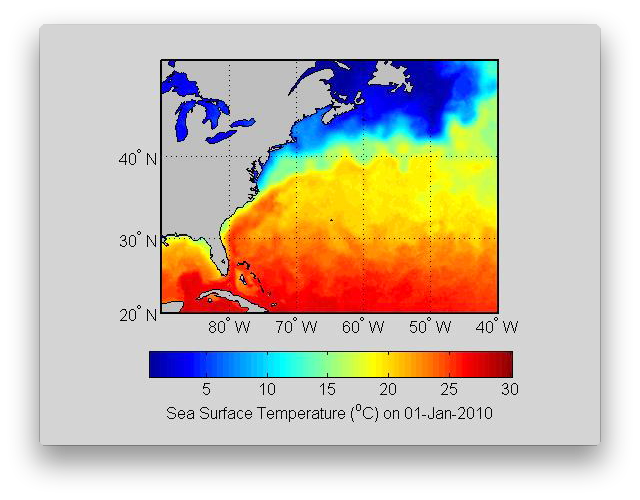
Animations of Sea Surface Temperature (SST) maps produced by Mike Chin (JPL) using a multi-resolution method for blending the different satellite SST products.
One year of daily SST maps from 2010 were used to produce these animations.
The most evident signal in the SST maps is the annual cycle; SST starts to warm up
during spring, maximum values occur in late summer or early fall, cooling in
the fall, and minimum values are observed at the end of winter.
Follow this link to see an animation for each Atlantic Ocean Current. |
(12 sec; 6.5 MB; MPG file) |
Figure 1.
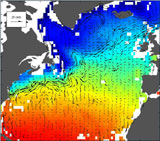
This movie loop contains daily plots of the average seasonal
signal in near-surface temperature and horizontal velocity measured
by near-surface drifters in the North Atlantic. The temperature scale
is in °C with red being the warmest water. Velocity vectors
scale linearly with speed and they point in the direction of the flow.
The average seasonal signal is determined by least-square fitting of
a constant mean, sine, and cosine functions with annual periods to the
temperature and to the velocity data. Only significant estimates from
the one degree square longitude-latitude bins are plotted.
(Calculations and movie by Rick Lumpkin, CIMAS). |

(12 sec; 5.8 MB; MPG file) |
Figure 2. Same as Figure 1 but for the Tropical Atlantic. |
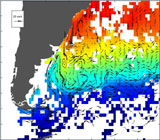
(12 sec; 8.2 MB; MPG file) |
Figure 3. Same as Figure 1 but for the South Atlantic. |
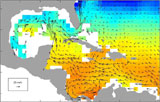
(12 sec; 5.8 MB; MPG file) |
Figure 4. Same as Figure 1 but for the Caribbean Sea and Gulf of Mexico. |

(9 min, 44 sec; 63 MB; WMV file) |
Figure 5.
"A Submesoscale Vortex in the Coastal Ocean Detected
by Very High Frequency Radar".
An animation of the Florida current from OSCR data taken during the 4-D
Current Experiment showing both along shore flow and eddies trapped
between the coast and the Florida current.
For more information on this experiment, see Nick Shay's 4D CE web site
at
http://storm.rsmas.miami.edu/~nick/four_d/.
(Animation by Arthur Mariano and Edward Ryan). |
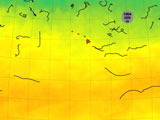
(9 min, 38 sec; 62 MB; WMV file) |
Figure 6.
"Drifting Buoy Clusters".
This animation was made for the "Favorite Trajectories" section
of the LAPCOD 2000 meeting
held in Ischia, Italy on October 2-6, 2000.
The first part shows all of the near surface trajectories in 3 time
frames (1985-1990, 1991-1994, 1995-1998) for each of the 3 main ocean basins
(Atlantic, Indian, and Pacific).
The second part shows close ups of various clusters of buoys.
(Animation by Arthur Mariano and Edward Ryan). |
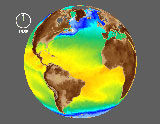
(7 min, 28 sec; 47 MB; WMV file) |
Figure 7.
"Spin: Global Sea Surface Temperature derived from
Satellite AVHRR measurements".
SST from 1985-1995 in the Atlantic, Indian and Pacific basins.
This animation was made for and shown at the RSMAS ONR site review
in the spring of 1998.
(Animation by Arthur Mariano and Edward Ryan). (Click here for a 77 MB QuickTime movie, 320x240). (Click here for a 47 MB Windows Media Player, 640x480). |
(7 min, 32 sec; 48 MB; WMV file) |
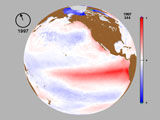
Figure 8.
"Low-frequency Sea Surface Temperature (SST)
Variability".
SST anomalies from 1985-1998 in the Atlantic, Indian and Pacific basins.
This animation was made for and shown at the RSMAS ONR site review
in the spring of 2000.
(Video provided by Arthur Mariano and Edward Ryan). |
(7 sec; 18 MB; AVI file) |
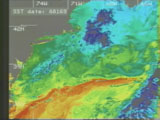
Figure 9.
Two-day composites of Sea Surface Temperature (SST), based on Advanced Very
High Resolution Radiometer (AVHRR) data from NOAA satellite 9, from
June, 1988 to September, 1989 for the Mid-Atlantic Bight, Slope Water,
and the Gulf Stream. All satellite image data are combined over a 2 day period
by retaining the warmest pixel to reduce cloud contamination.
Orange/Red represents warm sea-surface temperature (SST), blue is cool SST;
purple/black/white are clouds. The outline of the mid-Atlantic States
and New England is shown in gray. Cape Hatteras, North Carolina is in
the lower left corner of the frame. Super-imposed on the AVHRR images is a
current meter vector. The scale is given by the 1 m/s vector (the arrow)
near the date. When the Gulf Stream passes over the Current Meter, speeds
over 2 m/s are measured. When the Gulf Stream shifts south, the measured
currents are an order of magnitude slower.
As the video starts, the Gulf Stream is seen as the warm water orientated nearly eastward between 36°N and 39°N. Gulf Stream meanders grow as the stream separates from the coast as it passes east of Cape Hatteras, North Carolina. Large meanders to the north,close in on themselves and form Warm Core Rings (WCRs). WCRs are visible as warm, usually nearly-circular patches of water with a diameter of 100 to 200 km found in the midst of the cooler slope waters north of the stream. Their movement is constrained by the Gulf Stream to the south and by the North American continental shelf to the north. To the south, deep Gulf Stream meander "troughs" develop into Cold Core Rings (CCRs). CCRs are visible, south and east of the stream, as cold patches of water in the warmer Sargasso Sea. Between year days 203 and 263, 1988, there are 3 to 5 WCRs visible north of the Gulf Stream. Summertime heating erodes the SST signal associated with the WCRs. For year days 269 and 271, a WCR is seen peeling off warmer Gulf Stream water as the WCR interacts with a Gulf Stream Meander. This interaction was surveyed as part of the Anatomy of a Meander/BIOSYNOP experiments. Starting on year day 279, a deep trough of cold water is visible near 68°W. This trough becomes a CCR (see year days 289-301, 1988). On year day 331, 1988 there is an impressive image of Gulf Stream meanders showing three WCRs. There are many cloudy days in the winter. A good example of mixing between the slope waters and Gulf Stream can be seen on year day 75, 1989. On year day 85, 1989, there is a good example of a CCR wrapping warmer Gulf Stream waters around its core (see the lower left hand corner). Two other CCRs are barely visible near 68°W and 65°W. Also see year day 107, 1989 for a nice image of a CCR interacting with the Gulf Stream around of 66°W. A large meander is visible which grows and propagates to the east during spring and summer of 1989. The meander forms a deep trough and then evolves into a "S-shaped" meander, that eventually spawns a WCR (see year days 221, 237, and 251, 1989). Another WCR, formed further east, propagates westward and interacts with the newly-formed WCR. (Video from Bob Evans and the RSMAS Remote Sensing Lab). |
(4 sec; 12 MB; AVI file) |
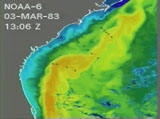
Figure 10.
Sea Surface Temperature (SST), based on AVHRR data from NOAA 6, 7, 8
satellites, for two spring-time periods in the South Atlantic Bight
(03-March-1983 to 25 June-1985; 22-March-1984 to 06-June-1984).
Orange/Red represents a warm SST, blue is cool SST; and clouds are shown
by purple/black/white in the images. The two video clips illustrate the
deflection and meandering of the Gulf Stream at the Charleston "Bump"
(March 3-12, 1983); show several spin-off eddies (March 22, 1984) inshore
of the Gulf Stream; and reveal spring-time warming, from April to May, of
the coastal waters offshore of the southeastern U.S. and of the Gulf Stream
current. A mushroom-shaped vortex can be seen around May 5, 1984.
Spin-off eddies were first observed inshore of the Florida Current in current meter and hydrographic data by Tom Lee in 1970 (see Lee, 1975; Lee and Mayer, 1977). They were first observed in early satellite and radiometric measurements and found to be common offshore of Florida and in the South Atlantic Bight (DeRyeeke and Kao, 1973; Stumpf and Rao, 1975; Legeckis, 1975). As these video clips illustrate (see April 22, 1983; April 25-26, 1984;), spin-off eddies are important for mixing Gulf Stream and coastal water masses together (Lee at el., 1991). These eddies can propagate northward at speeds ranging from 10 to 100 cm/s. Their size, in general, increases from 10 to 30 km offshore of Florida to an along-stream size 100 to 200 km and cross-stream size of 30 to 50 km near Cape Hatteras. Their primary area of spin-off eddy generation is at the Charleston Bump, however they are also commonly seen forming just north of the Bahama Bank and the Florida Straits where the Florida Current is no longer constrained by the southeast coast of Florida and the Bahamas. (Video from Bob Evans and the RSMAS Remote Sensing Lab). References DeRycke, R.J. and P.K. Rao, 1973: Eddies along a Gulf Stream boundary viewed from a very high resolution radiometer. J. Phys. Oceanogr., 3, 490-492. Lee, T.N., 1975: Florida Current spin-off eddies. Deep Sea Research, 22, 753-765. Lee, T.N., and D. Mayer, 1977: Low frequency current variability and spin-off eddies along the shelf of Southeast Florida. J. Marine Res., 35(1), 193-220. Lee, T.N., C. Rooth, E. Williams, M. McGowan, A. Szmant, and M.E. Clark, 1991: Influence of Florida Current, gyres, and wind-driven circulation on transport of larvae and recruitment in the Florida Keys coral reefs. Continental Shelf Res., 12(7/7), 971-1002. Legeckis, R., 1975: Applications of synchronous meteorological satellite data to the study of time dependent sea surface temperature change along the boundary of the Gulf Stream. Geophys. Res. Letters, 2, 435-438. Stumpf, H.G., and P.K. rao, 1975: Evolution of Gulf Stream eddies as seen in satellite infrared imagery. J. Phys. Oceanogr., 5, 388-393. |
(32 sec; 64 MB; AVI file) |
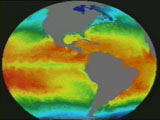
Figure 11.
Average Sea Surface Temperature (SST) based on AVHRR data from NOAA
satellites is mapped on a spinning globe. Orange/Red shows a warm SST,
blue is cool SST; The annual cycle of SSTs is shown for the Atlantic Ocean
and E. Pacific. In the first sequence, from April to August the North Atlantic
warms while the South Atlantic cools down. By late September/October, the
North Atlantic cools, while the South Atlantic warms up. The video then
zooms in on the Gulf Stream region and further focuses in on the southwest
movement of warm core ring 1982B.
(Parts of this figure are from Bob Evans and the RSMAS Remote Sensing Lab; Spinning globe produced by Jim Brown and Angel Li). |
(9 sec; 21 MB; AVI file) |
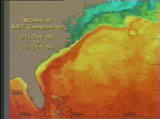
Figure 12.
Five-day composites of Sea Surface Temperature (SST), based on AVHRR
data from NOAA satellite 9, for the time period 01-Jan-1985 to 25-Oct-1988
for the Florida Current and the Gulf Stream. All satellite data images,
over a 5 day period, are combined by retaining the warmest pixel to reduce
cloud contamination. Orange/Red shows a warm SST, blue is cool SST; On the
average, the Florida Current follows the topography. The Gulf Stream Current
starts meandering near the Charleston Bump. These meanders grow as the
Gulf Stream separates from the coast, east of Cape Hatteras, North Carolina.
Large meanders to the north, close in on themselves and form Warm Core Rings
(WCRs). WCRs are visible as warm, usually nearly-circular patches of water
with a diameter of 100 to 200 km found in the midst of the cooler slope waters
north of the stream. Their movement is constrained by the Gulf Stream to
the south and by the North American continental shelf to the north.
To the south, deep Gulf Stream meander "troughs" develop into Cold Core
Rings (CCRs). CCRs are visible, south and east of the stream, as cold
patches of water in the warmer Sargasso Sea.
Two WCRs and two CCRs are visible from the end of March/April, 1985. At this time, Gulf Stream meanders propagate towards the east and northeast. During June, 1985 there is a large WCR on the continental shelf; an event that brings good fishing closer to shore for anglers in the mid-Atlantic states. In August 1985, four WCRs are present, see September 16 1985 for a nice image, and starting September 26, 1985, the Gulf Stream bifurcates near 67°W. During Jan 1986, the stream cools, and in Mar 1986, there is a WCR just north of a CCR in the northeast corner of the image. From June to July, 1986, the Gulf Stream meanders propagate to the east and two CCRs are entraining warmer SST water. During November and December, 1986, the Gulf Stream is straight. From March through June, and from August 21 through November of 1987, there are two to three CCRs visible. Two CCRs are near each other on June 6-16, 1987, and a deep trough meander is visible in the data (March 6, 1987; November, 1987). An "Omega"-shaped Gulf Stream meander is visible in Jan, 1988. From March to April, 1988, there is a sequence of Gulf Stream meanders propagating to the east/northeast. Around June 1, 1988, a strong subtropical front is evident, and in July, 1988, 3 WCRS are observed. By late September, 1988, four to five WCRs are present north of the Gulf Stream. (Video from Bob Evans and the RSMAS Remote Sensing Lab). |
(1 min, 14 sec; 112 MB; AVI file) |
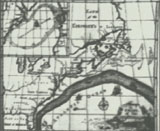
Figure 13.
Two-day composites of Sea Surface Temperature (SST), based on AVHRR data
from NOAA satellite for the Gulf Stream region. Orange/Red is warm SST,
blue is cool SST; A sequence of raw, unedited data are shown. Missing data
is given by black and grey, and cloud contamination (purple to white and grey)
is visible.
The video begins with a map of the Gulf Stream as envisioned by Ben Franklin in 1774 using the information given to him by his cousin, Timothy Folger, a whaling ship captain from Nantucket. Appearing in the bottom right corner, the two-day composite sequence of sea surface temperature (SST) shows the actual Gulf Stream as it veers from the continental shelf near Cape Hatteras, NC. The central portion of the video shows a composite sequence prior to "filling in" for the missing data (clouds, etc.) by using the surrounding pixel information, other sources of data, and careful extrapolations. When viewed quickly, the meandering of the Gulf Stream becomes evident. The "clean" view is then provided in which the missing data is emplaced, clearly showing the warm-core (WCR) and cold-core rings (CCR) or eddies that are formed by the meandering of the Gulf Stream. RAFOS float data (small black swirling dots) are then super-imposed on the SST maps. The floats drift with the water in the main thermocline at depths between 200 and 800 m in the Gulf Stream. The floats either stay in the stream, end up in two WCRS, or end up in a CCR. The video sequence then zooms in further on a small area of the Stream, on which is superimposed a topographic map of the depth of the main thermocline, based on inverted echos sounder measurements. As with the float data, there is a good correspondence between in-situ data measuring the thermocline properties of the Gulf Stream and satellite data, which is a measurement of the "skin" temperature of the upper few mm of the water column. (Video from Peter Cornillon using data from Tom Rossby and Randy Watts, all from U. of Rhode Island). |
(1 min, 9 sec; 85 MB; AVI file) |
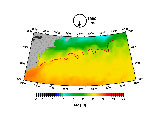
Figure 14.
The position of the Gulf Stream Northern Edge (brown line) is superimposed on
this map, which shows a space-time interpolated two-day composites of
Sea Surface Temperature (SST) based on AVHRR data from NOAA satellite.
The Gulf Stream Northern Edge is the surface expression of the thermal front that separates cooler, fresher Slope waters from warmer, saltier Gulf Stream waters. The time period is from January, 1985 to June 1996. The seasonal warming/cooling of the Northwest Atlantic and the Gulf Stream is evident. In general, Gulf Stream meanders propagate toward the east with average speeds of 10 to 15 cm/s, they grow as they travel eastward, and that the average meander wavelength is between 350 and 450 km. There are large variations in stream shape and meander size in this eleven year data set. There is also a subtle annual cycle of the Gulf Stream that shows the current migrating southward south in late winter/early spring and moving northward in late summer/early fall. This annual migration has an average amplitude of about 100 km. Mesoscale variability ranges from weeks to months with meander amplitudes of 200 to 300 km. During the winter, the Gulf Stream appears straighter in the east. This is primarily due to the increased cloud cover and consequential lack of thermal data in the winter. (Gulf Stream Northern Edge Position data from Mike Chin). |
(1 min, 2 sec; 120 MB; AVI file) |
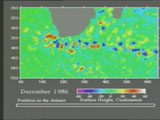
Figure 15.
Shown here is a composite of Sea Surface Height (SSH) data from December
1986 to February 1989 of the warm Agulhas Current,
which flows across the
tip of South Africa (island to the right is Madagascar). Warm colors
(yellows-reds) show higher than mean SSH and cool colors show lower than
mean SSH. Popular wisdom claims that the cape was named "L'agulas"
for its needle-sharp reefs, but maritime legend has it that it was off
the tip of the cape that Portuguese sailors noticed that their compass
needles showed no deviation between true and magnetic north and thus named
it the "Cape of the Needle" or Cape Agulhas. This video illustrates the
westward propagation of ocean eddies and that these Agulhas Rings are an
important mechanism for relatively warm, salty waters from the Indian
Ocean to be transported and mixed in the cooler, fresher South Atlantic Ocean.
(Video courtesy of NASA). |
(1 min, 35 sec; 136 MB; AVI file) |
Figure 16.
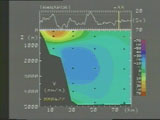
"The Deep Western Boundary Current: A Plane View East of Abaco, The Bahamas."
The images are derived using data from four current meter moorings, deployed
from March 1987 and recovered in June 1988. The region east of Abaco in
the Bahama Islands, is shown. The current meter mooring had instruments at
depths ranging from 50 m to 5000 m and was designed to study the
Antilles Current and the Deep Western Boundary Current. The vertical axis
is water depth and the horizontal axis is distance offshore of the Bahamas.
Red colors indicate northward flow and blue denotes southern flow. The
velocity scale in cm/s is given on the right. The transport through this
section is given as a function of day in the top plot. There are ten days
between tick marks on the transport time series plot. Instrument locations
are given by black squares.
The net transport is to the south because of the Deep Western Boundary Current (DWBC) carrying North Atlantic Deep Water south along the continental slope. The DWBC meanders from west to east and at times, it meanders 80 km offshore. When the DWBC is offshore, a northward flowing ocean eddy is found inshore centered around 3500 m. Shallower eddies are also visible as they propagate into the area from east to west. Maps are also shown with two different mean sections removed. These meridional (south-to-north) velocity anomaly videos show fluctuations that are mostly weakly depth-dependent and have weekly to monthly periods associated with westward-propagating planetary waves (also known as Rossby waves). (Video produced by R.J. Zantop, W.E. Johns, and T.N. Lee). |
(11 sec; 23 MB; AVI file) |
Figure 17.
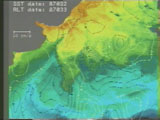
Five-day composites of sea surface temperature (SST), based on AVHRR data
for the time period December 1986 to December 1988 for the Brazil-Malvinas
confluence area. Also shown are altimetric sea surface height data and
moored current meter data. The satellite data images, over a five day period,
are combined by retaining the warmest pixel to reduce cloud contamination.
Orange/Red represents warm SST, blue is cool SST. There is some cloud
contamination, which appears as grey splotches. Low sea surface height (SSH)
is given by the dark contours and high SSH by light contours; units are in
centimeters. Current meter vectors from George Wetherly of Florida
State University are also shown for selected times.
The Brazil-Malvinas confluence area is where the warm southward flowing Brazil Current interacts with the northward flowing Malvinas Current. It is an energetic current because of the mesoscale eddies that propagate westward towards South America. The video clips show the general motion of the high and low pressure systems towards the west. Also evident is the stretching of eddies by the Brazil Current and by the Malvinas Current. There is a strong correlation between low sea surface heights and colder SST and between high sea surface height and warmer SST. Ocean eddies are also visible in the current meter data. As the different phases of the eddies pass over the current meters, the current vectors change their direction and rotate on weekly time scales. Maximum current speeds are between 20 and 30 cm/s. (Video from Bob Evans and the RSMAS Remote Sensing Lab). |
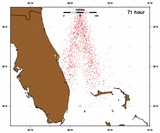 |
Figure 18.
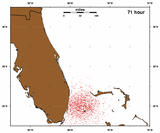
The top animation is from a simple,
idealized model of the Florida Current
and turbulent diffusion. 1681 particles are released, in the high velocity
core of the Florida Current, at time zero, and are uniformly distributed
about 26°N and 79°30'W. Over the three-day simulation the particles
disperse due to the advection by the spatially-varying mean flow,
turbulent diffusion, and the interactions of these two terms.
After 72 hours, particles that formed a very tight cluster
disperse over a wide range of the ocean offshore of Florida.
The middle animation shows the dispersion due to only turbulent diffusion. Turbulent diffusion is modeled using a random-flight model that assumes the particle velocity is correlated in time. This model parameterizes the fluid motion not described by the simple mean flow. This motion includes the meandering of the current, eddies, tides, turbulent stirring, waves, and random motion. The stochastic model used for the zonal (east-west) and meridional (south-north) velocity components assumes that the velocity at time t is linearly related to the velocity at the previous time plus a random noise term. The random noise has an eddy kinetic energy of 1000 m2s2 and the constant is picked so that motion is uncorrelated after two days, e.g. the turbulent motion at day 2 is independent of the turbulent motion at day 0. The bottom animation shows just the advection by the mean flow. The mean flow is assumed to be constant in latitude and has a Gaussian shape in longitude with a maximum velocity of 2 ms-1 (about 4 knots) at 79°30'W. The velocity decay or e-folding scale is about 25 km. V(x) = 200 * exp(-(x'/25)2) |
