 |
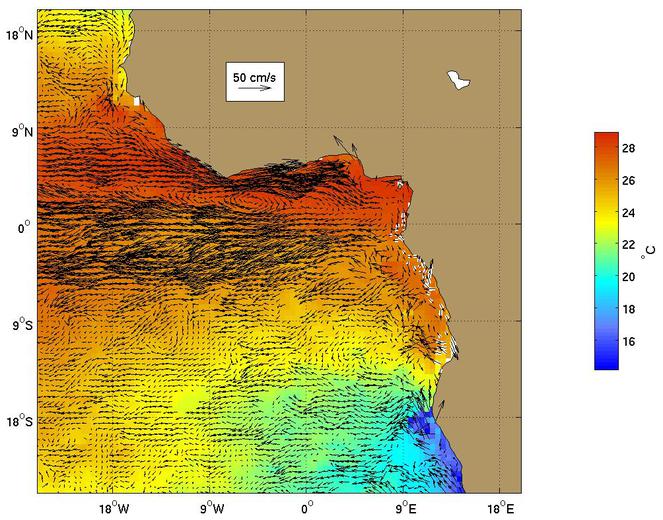
Figure 1.
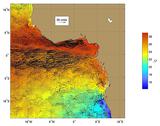
The Angola current as represented by the Mariano Global
Surface Velocity Analysis (MGSVA). The velocity estimates from the
MGSVA were calculated at a resolution of one degree of longitude and
latitude and it does not resolve the narrow Angola current that hugs
the coast. The white arrows highlight the northern flow associated
with the Angola-Benguela Frontal Zone and the northerly flow of
the Benguela Current.
Click here for example plots of
seasonal averages.
|
|
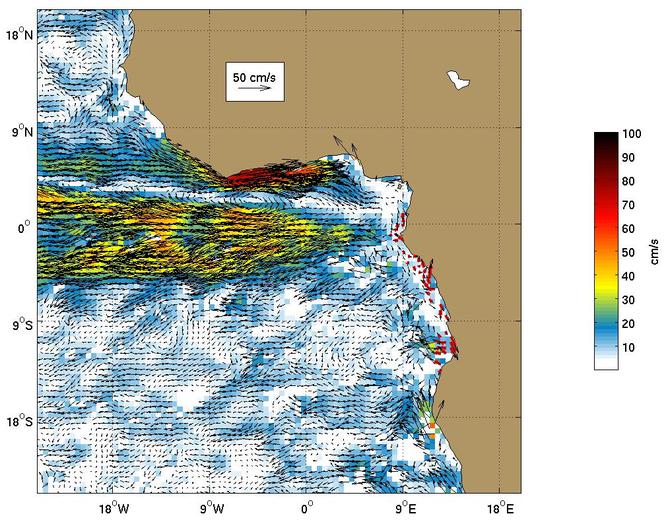
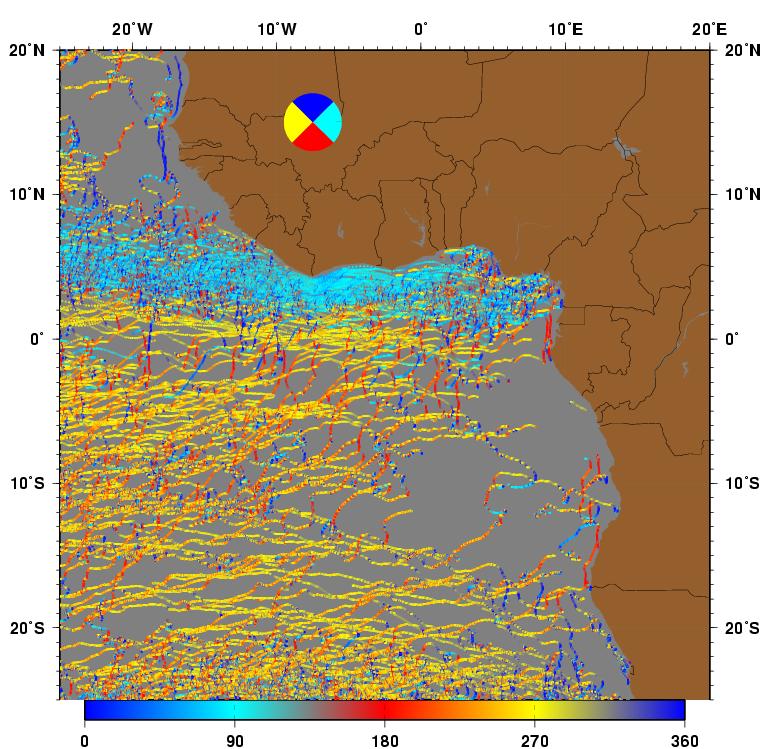
Figure 2.
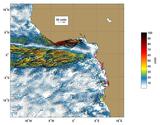
Global Ocean Surface Velocities from Drifters
(top panel w/ SST, bottom panel w/ Speed)
Figure Caption is Under Construction.
Click here for example plots of
seasonal averages.
|
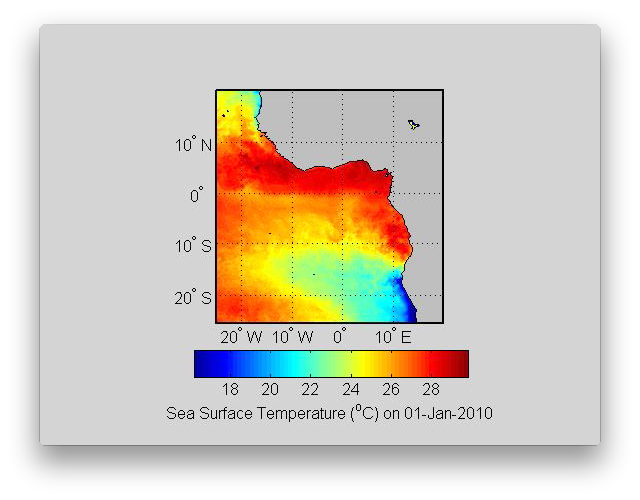 |
Figure 3.
In the region surrounding the Angola Current there is significant upwelling of
cooler water. Upwelling is most visible in this animation along the coast of
Africa near the latitude of 20°S and right along the equator. The upwelling is
due to a process called Ekman transport.
( Click the thumbnail to play the animation. )
|
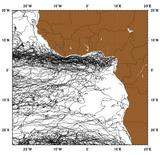 |
Figure 4.
|
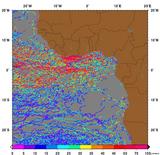 |
Figure 5.
|
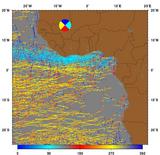 |
Figure 6.
|
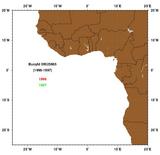 |
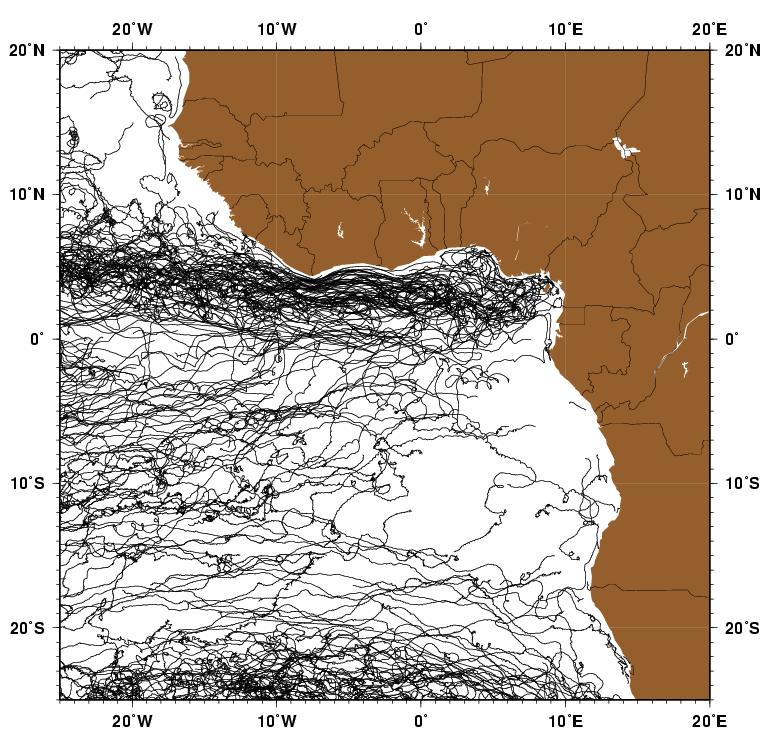
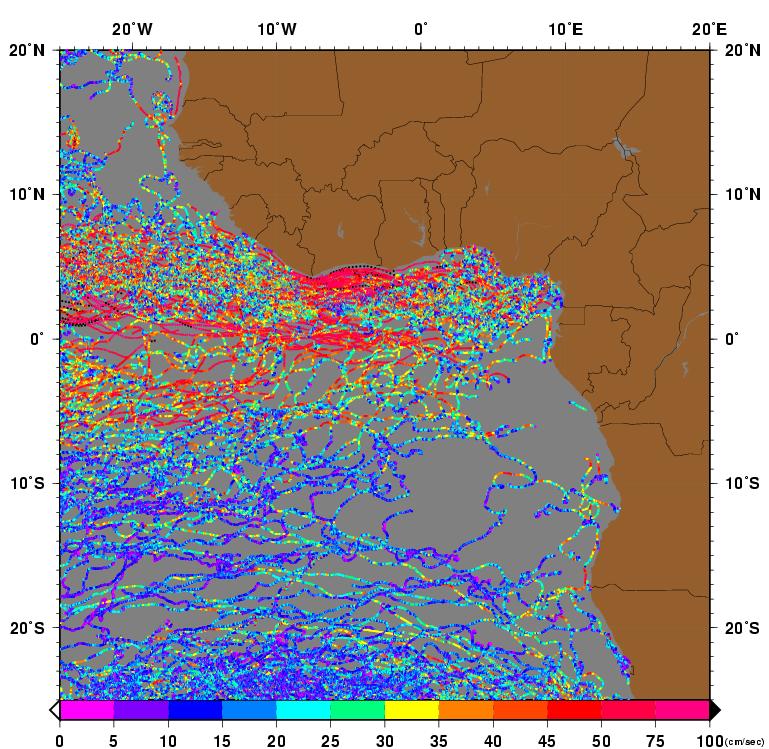
Figure 7.
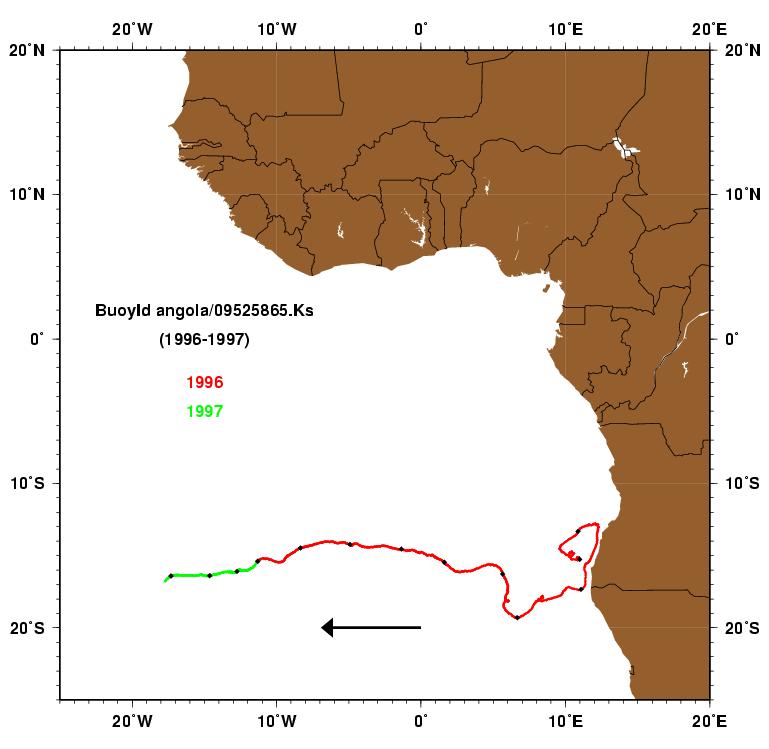
Buoy 09525865 is entrained into the Angola Current near 12°S, flows
along the coast for 21 days in May of 1996 ,
and enters the South Equatorial Current.
Because of the narrow width of the current, its proximity to shore
and fisherman finding the buoys, and the sparse sampling in this part
of the ocean, there are not any examples of buoys trajectories
that span the entire extent of the Angola Current.
|
 |
Figure 8.
AVRRR image of the sea-surface temperature (SST).
|
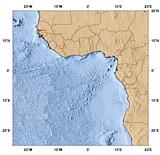 |
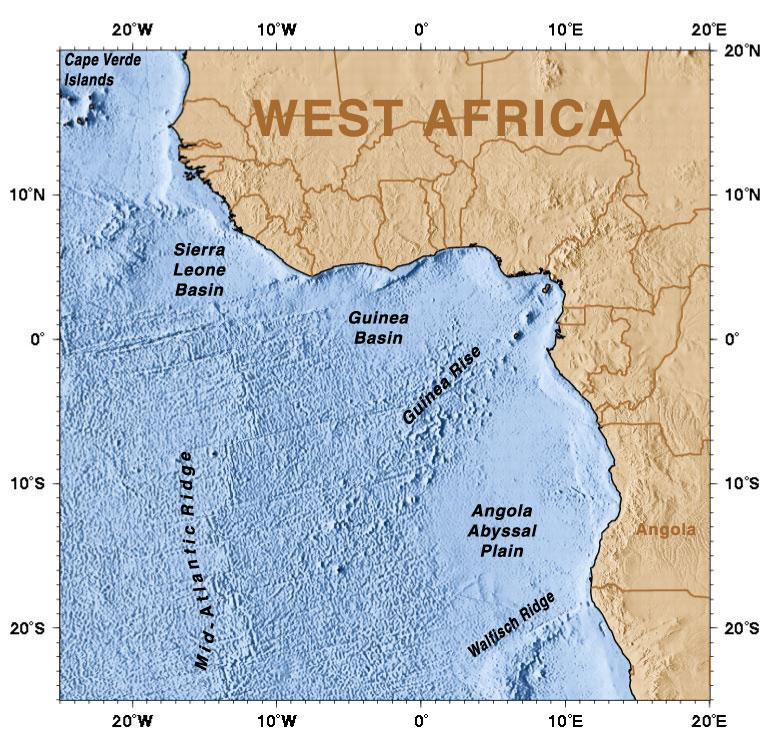
Figure 9.
Geography of the region.
|
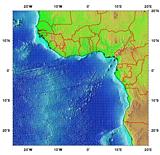 |
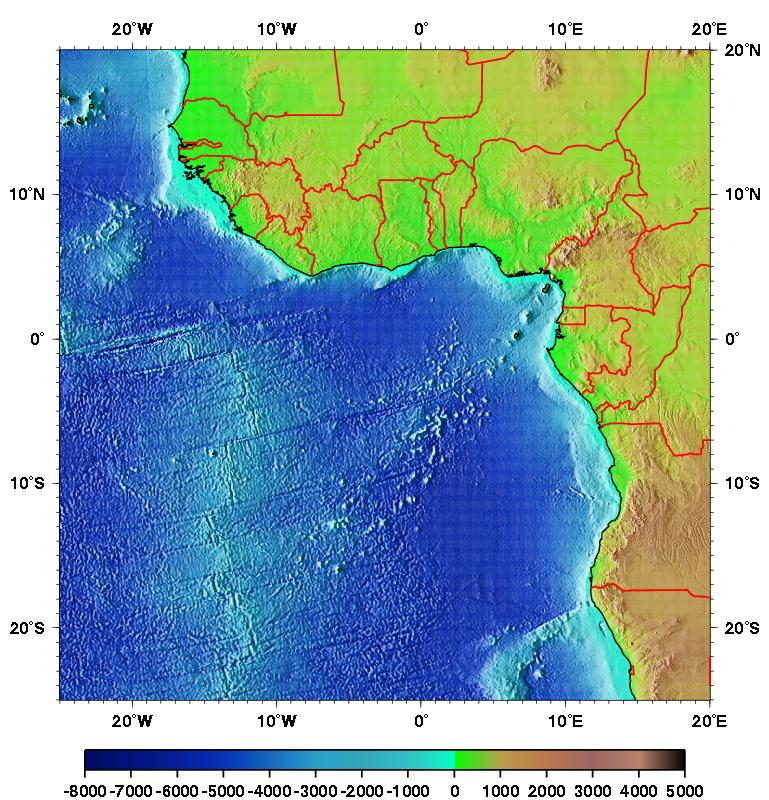
Figure 10.
Topography/Bathymetry of the region.
|